Comparative Study
. 2018 Mar;29(3):785-805.
doi: 10.1681/ASN.2017080887. Epub 2018 Feb 15.

Conserved and Divergent Features of Human and Mouse Kidney Organogenesis

Affiliations
Comparative Study

Conserved and Divergent Features of Human and Mouse Kidney Organogenesis

Nils O Lindström et al. J Am Soc Nephrol. 2018 Mar.

Abstract

Human kidney function is underpinned by approximately 1,000,000 nephrons, although the number varies substantially, and low nephron number is linked to disease. Human kidney development initiates around 4 weeks of gestation and ends around 34-37 weeks of gestation. Over this period, a reiterative inductive process establishes the nephron complement. Studies have provided insightful anatomic descriptions of human kidney development, but the limited histologic views are not readily accessible to a broad audience. In this first paper in a series providing comprehensive insight into human kidney formation, we examined human kidney development in 135 anonymously donated human kidney specimens. We documented kidney development at a macroscopic and cellular level through histologic analysis, RNA in situ hybridization, immunofluorescence studies, and transcriptional profiling, contrasting human development (4-23 weeks) with mouse development at selected stages (embryonic day 15.5 and postnatal day 2). The high-resolution histologic interactive atlas of human kidney organogenesis generated can be viewed at the GUDMAP database (www.gudmap.org) together with three-dimensional reconstructions of key components of the data herein. At the anatomic level, human and mouse kidney development differ in timing, scale, and global features such as lobe formation and progenitor niche organization. The data also highlight differences in molecular and cellular features, including the expression and cellular distribution of anchor gene markers used to identify key cell types in mouse kidney studies. These data will facilitate and inform in vitro efforts to generate human kidney structures and comparative functional analyses across mammalian species.

Keywords: human genetics; kidney development; nephron.


Figures

None
Graphical abstract
Figure 1.
Figure 1.
Summary of samples used in the study. Graphed data for specimens used for H&E, SISH, IHC, whole-mount (WM), and RNA-seq. H&E, Hematoxylin and eosin; IHC, Immunohistochemistry; SISH, Section in situ hybridization; RNA-seq, RNA-sequencing.
Figure 2.
Figure 2.
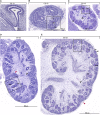
Histologic analyses of human kidney development show emerging complexity in the human kidney. (A–E) Hematoxylin and eosin staining of human kidneys from CS13 to CS23. Scale bars as indicated on fields. Black arrowheads point to cell striations, red arrowheads point to surface indentations. Boxed areas shown in Figure 5. CD, collecting duct; CM, cap mesenchyme; DT, distal tubule; RC, renal corpuscle; UB, Ureteric bud epithelium; UBT, ureteric bud tip.
Figure 3.
Figure 3.
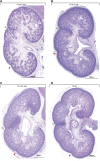
Histologic analyses of human kidney development show emerging complexity in the human kidney. (A–D) Hematoxylin and eosin staining of human kidneys from week 10 to week 16. Scale bars as indicated on fields. Red arrowheads point to surface indentations, green arrowheads point to lobe folds.
Figure 4.
Figure 4.
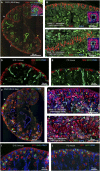
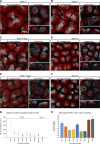
Immunofluorescent characterization of early human kidney development and lobulation show conserved and divergent features. (A–C) Sagittal sections of a week 8 (CS23) and week 15 kidney with immunofluorescent labeling for SIX2, KRT8/18, and PHH3 (insert shows high magnification of week 8 tip and nephron progenitors; scale bar, 20 µm). (B and C) Peripheral and interlobular regions of week 15 cortex, respectively. Inserts show high magnification of tips with surrounding nephron progenitors. Scale bars in inserts are 20 µm and inserts show SIX2, KRT8, and DAPI stain. Arrowheads in inserts point to polarized progenitor cells. Equivalent stains for mouse E15.5 and P2 are shown in (D and E). (F–H) Sagittal section of a week 8 (CS23) and week 15 kidney with staining for WT1, JAG1, and CDH1. (G and H) Peripheral and interlobular regions of week 15 kidney cortex, respectively. (I and J) Equivalent stains for mouse E15.5 and P2 stages. White arrowheads point to lobe folds, open arrows point to multilayered cap mesenchyme, and yellow arrowheads point to polarized progenitors around tips. White dashed lines demark where lobes meet.
Figure 5.
Figure 5.
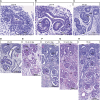
Histologic analyses of human kidney development show nephron formation and maturation. (A–H) Hematoxylin and eosin staining of human kidneys from CS16 to week 16 kidney as specified on fields. Magnified fields from Figure 2 have been rotated so top and bottom reflect the cortico-medullary axis. Scale bars as indicated on fields. CM, cap mesenchyme; DT, distal tubule; RC, renal corpuscle; UBT, ureteric bud tip.
Figure 6.
Figure 6.
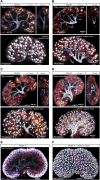
3D whole-mount analyses of early human kidney development display the formation of the collecting duct system and nephrons. (A–F) Immunofluorescently labeled whole human kidneys at CS20, CS22, CS23, and week 11 stained for JAG1 to mark nascent nephrons and KRT8 to highlight the ureteric bud. The week 11 sample also stained for WT1 to mark glomeruli. Nephron counts performed using the JAG1 stains and highlighted using spheres. Nephron counts and scale bars as indicated on fields. a.b., anterior domain branch, indicated with dashed lines and arrowheads; i.b., interdomain branch; p.b., posterior domain branch.
Figure 7.
Figure 7.
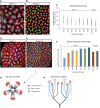
Three-dimensional characterization of the human nephrogenic compartment shows gradual reduction in progenitor endowment. (A–F) Whole-mount immunofluorescent stains for SIX1 and KRT8 in week 11 to week 23 kidneys. Images display a view from the top of the nephrogenic compartment looking downward toward the center of the kidney, a single confocal section, and the side-view of the niche. Single slices also display PHH3 stain. (G) Quantitative analysis of the number of nephron progenitor cells per ureteric bud tip. (H) Quantitative analysis of PHH3+ cells in the SIX1 + cell population. ms, mouse.
Figure 8.
Figure 8.
Three-dimensional characterization of the human nephrogenic compartment shows complex arrangements of tips and niches. Whole-mount immunofluorescent stains for SIX1 and KRT8 in week 11 to week 23 kidneys and quantitative analyses. (A, B, D, and E) Images displaying lower magnification overview of changes to the tip niche morphologies. Green spheres indicate individual terminal points of tips which were measured to analyze tip-to–nearest-tip distances. (C and F) Quantitative analysis of distances between tips and number of “tips-per-niche” during development. Colored areas in (D and E) highlight individual clusters of niches and the numbers indicate tips per cluster. (G and H) Schematic showing the top-view architecture of the rosettes and the side-view distribution of tips, niches, nascent nephrons, and mature nephrons (arcading not shown). ms, mouse.
Figure 9.
Figure 9.
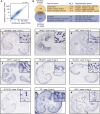
Identification of genes differentially expressed during maturation of human embryonic kidney. (A) Gene-level correlation of normalized mRNA-seq reads between week 9 human kidney samples and week 21 human kidney samples. (B) (Left) Number of differentially expressed genes between week 9 human kidney samples and week 21 human kidney samples. (Middle) Results of gene ontology (GO) term enrichment analysis of the indicated gene sets, with representative ones (right) from each set of genes. (C–K) Expression of genes defined as anchor genes in the mouse. Human samples range in age from week 14 day 4 to week 16 day 3. Expression and age as defined on the fields. Square inserts show magnified representative regions of nephron segments and kidney compartments that were labeled. huKidney, human kidney; TPM, Transcripts Per Kilobase Million.
Figure 10.
Figure 10.
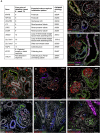
Kidneys from weeks 8, 10, and 11 embryos and fetuses immunostained for nephron markers indicate when mature cell types develop in the human kidney. (A) Table indicating the expected detection pattern for proteins used in figure. (B–F) Week 8. (G and H) Week 10 day 3. (I) Week 11 day 4. The antibody stains and structures are as indicated on fields. Scale bar is 50 µm. CD, collecting duct; DT, distal tubule; LOH, loop of Henle; RC, renal corpuscle.

Comment in

References

    1. Costantini F, Kopan R: Patterning a complex organ: Branching morphogenesis and nephron segmentation in kidney development. Dev Cell 18: 698–712, 2010 - PMC - PubMed
    1. Little MH, McMahon AP: Mammalian kidney development: Principles, progress, and projections. Cold Spring Harb Perspect Biol 4: 1–18, 2012 - PMC - PubMed
    1. McMahon AP: Development of the mammalian kidney. Curr Top Dev Biol 117: 31–64, 2016 - PMC - PubMed
    1. Kobayashi A, Valerius MT, Mugford JW, Carroll TJ, Self M, Oliver G, McMahon AP: Six2 defines and regulates a multipotent self-renewing nephron progenitor population throughout mammalian kidney development. Cell Stem Cell 3: 169–181, 2008 - PMC - PubMed
    1. Boyle S, Misfeldt A, Chandler KJ, Deal KK, Southard-Smith EM, Mortlock DP, Baldwin HS, de Caestecker M: Fate mapping using Cited1-CreERT2 mice demonstrates that the cap mesenchyme contains self-renewing progenitor cells and gives rise exclusively to nephronic epithelia. Dev Biol 313: 234–245, 2008 - PMC - PubMed

Publication types