. 2018 Feb 16;359(6377):787-790.
doi: 10.1126/science.aan4074.

Dentate gyrus mossy cells control spontaneous convulsive seizures and spatial memory

Affiliations

Dentate gyrus mossy cells control spontaneous convulsive seizures and spatial memory

Anh D Bui et al. Science. .

Abstract

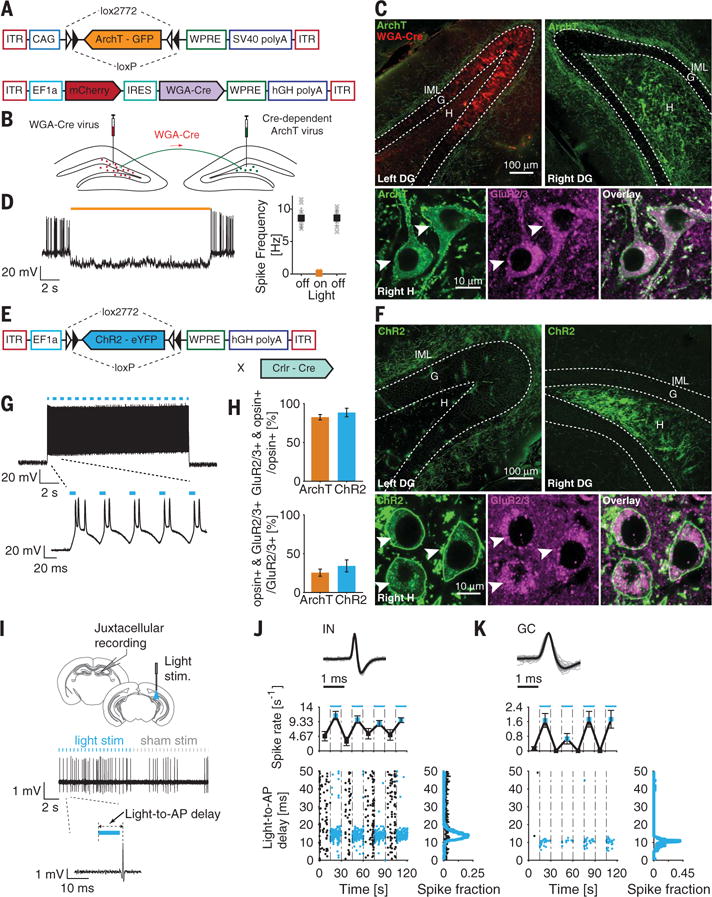
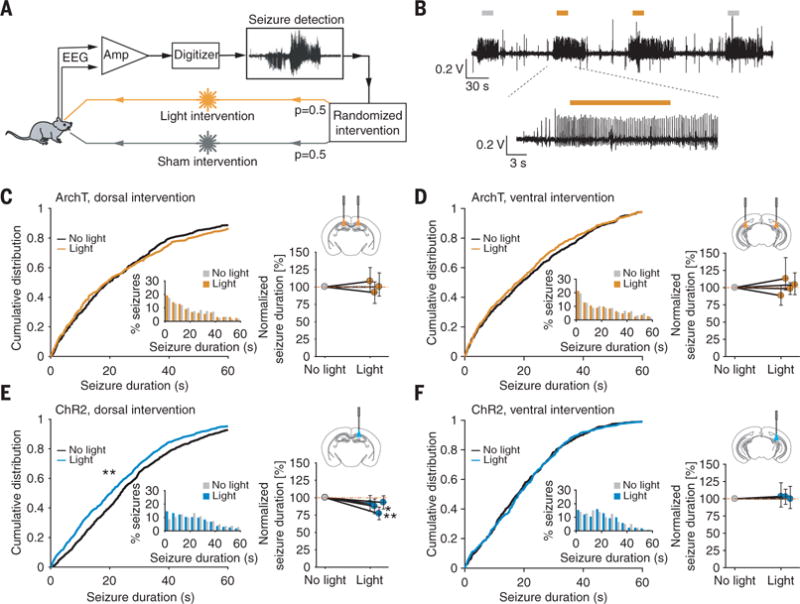
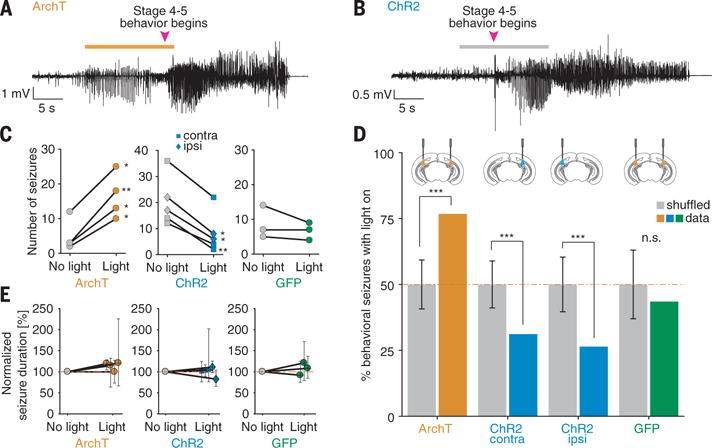
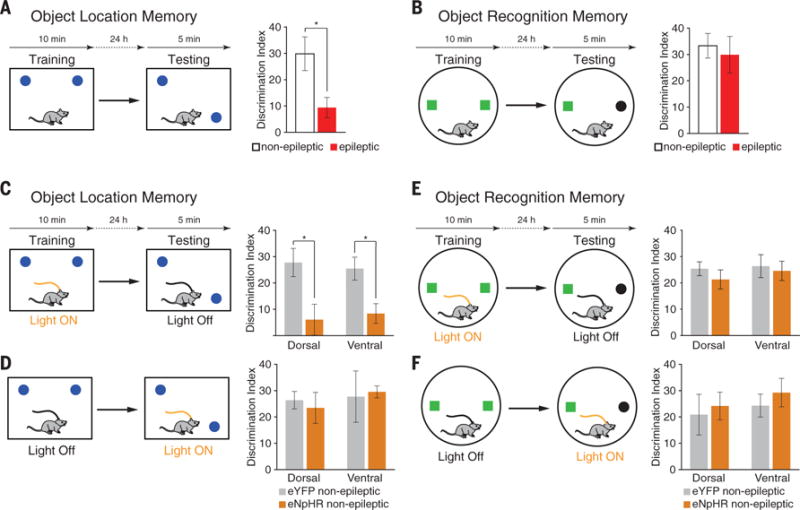
Temporal lobe epilepsy (TLE) is characterized by debilitating, recurring seizures and an increased risk for cognitive deficits. Mossy cells (MCs) are key neurons in the hippocampal excitatory circuit, and the partial loss of MCs is a major hallmark of TLE. We investigated how MCs contribute to spontaneous ictal activity and to spatial contextual memory in a mouse model of TLE with hippocampal sclerosis, using a combination of optogenetic, electrophysiological, and behavioral approaches. In chronically epileptic mice, real-time optogenetic modulation of MCs during spontaneous hippocampal seizures controlled the progression of activity from an electrographic to convulsive seizure. Decreased MC activity is sufficient to impede encoding of spatial context, recapitulating observed cognitive deficits in chronically epileptic mice.


Conflict of interest statement

We declare no conflicts of interest.

Figures

Fig. 1
Fig. 1. Selective optogenetic control of DG MCs
(A) ArchT expression system. (B) Topological targeting of MCs with a WGA-Cre fusion protein expressed in the left DG (red) that is transsynaptically and retrogradely trafficked by neurons with projections at the injection site. WGA-Cre activates ArchT expression in the right DG MCs (green). (C) (Top) Confocal images of WGA-Cre and ArchT expression. (Bottom) High-magnification images of the right hilus. ArchT-expressing MCs are identified via green fluorescent protein expression and GluR2/3+ immunostaining (arrowheads). (D) Illumination (15 s of 589-nm light) blocks current-induced spiking in ArchT-expressing MCs, quantified on the right (N = 10 recordings; n = 3 mice). (E) ChR2 expression system. (F) (Top) Confocal images of ChR2 expression. (Bottom) High-magnification images of the right hilus. ChR2-expressing MCs are identified via eYFP expression and GluR2/3+ immunostaining (arrowheads). (G) Illumination (473 nm, 15 s of a 20-Hz train of 10-ms pulses) induces ChR2-expressing MC firing (N = 5 recordings; n = 3 mice). (H) (Top) Opsin expression specificity (N = 103|24 slices; n = 3|5 mice for ArchT+|ChR2+). ArchT+ neurons were labeled using the WGA-Cre system, and ChR2+ neurons were labeled using the Crlr-Cre transgenic mouse system. (Bottom) Extent of opsin expression (N = 20|18 slices; n = 3|3 mice for ArchT+|ChR2+). (I to K) In vivo juxtacellular recordings of DG cells in MC ChR2-expressing mice. (I) (Top) Experimental schematic. (Bottom) Single-unit activity of an IN. [(J) and (K)] Neuronal activity of an IN (J) and a GC (K) in response to MC stimulation. (Top) Normalized spike (gray lines) and unit average (black line) waveforms. (Middle) Firing rate during alternating light-off (black) and light-on (blue) epochs. (Bottom) Scatter plot (left) and distribution plot (right) of the delay between the AP and the onset of the laser (blue) or sham pulse (black). All data are presented as mean ± SEM. G, granule cell layer; H, hilus; IML, inner molecular layer; AP, action potential.
Fig. 2
Fig. 2. Modulation of MC activity on electrographic seizure dynamics
(A) Closed-loop approach for in vivo real-time detection and optogenetic intervention of spontaneous seizures in epileptic mice. (B) Electrographic seizures, where no light (gray bar) or light (orange bar) is delivered upon seizure detection. (C to F) Light delivery to the dorsal or ventral DG of ArchT-expressing mice [(C) and (D)] and to the dorsal or ventral DG of ChR2-expressing mice [(E) and (F)]. (Left) Cumulative distribution and probability density (inset) of the seizure duration after the start of light or no-light delivery (N = 917|1194|2161|903 seizures, n = 3|4|4|3 animals for ArchT dorsal|ArchT ventral|ChR2 dorsal| ChR2 ventral). (Right) Normalized difference in seizure duration ± 95% confidence interval (CI) (*P < 0.05; **P < 0.01; Mann-Whitney U test).
Fig. 3
Fig. 3. MC optogenetic modulation during spontaneous seizures controls the progression of electrographic seizures into convulsive seizures
(A and B) Electroencephalogram recordings of electrographic-to-convulsive seizures in (A) an ArchT- and (B) a ChR2-expressing mouse with light (orange bar) or no light (gray bar) delivery after seizure detection. (C) MC photoinhibition increases (left), MC photostimulation reduces (middle), and light delivery to opsin-negative controls does not affect (right) the occurrence of convulsive seizures. *P < 0.05; **P < 0.01; two-tailed binomial test. (D) Control of seizure progression by MC modulation. Data are shown as the fraction of convulsive seizures occurring after light delivery (colored bars) compared with the fraction one would observe under the null hypothesis that light delivery has no effect (gray bars; expected fraction ± 95% CI). n.s., P > 0.05; **P < 0.01; ***P < 0.001; two-tailed binomial test. (E) MC activity modulation does not affect convulsive seizure duration. Data shown as normalized difference in seizure duration ± 95% CI (P > 0.05; Mann-Whitney U test). Contra, opsin expression contralateral to the KA injection site; ipsi, opsin expression ipsilateral to the KA injection site.
Fig. 4
Fig. 4. Chronically epileptic mice have impaired OLM but not ORM, and MC inhibition impairs learning but not retrieval of OLM
(A) OLM test schematic and timeline. Epileptic mice (n = 17) exhibit significantly impaired OLM, compared with nonepileptic controls (n = 13). (B) ORM test schematic and timeline. Nonepileptic (n = 10) and epileptic (n = 14) mice show no significant difference in ORM. (C) MC photoinhibition during learning interferes with OLM (dorsal: n = 9|10; ventral: n = 8|5 for eYFP|eNpHR). (D) MC photoinhibition during testing does not interfere with OLM (dorsal: n = 9|8; ventral: n = 6|7 for eYFP|eNpHR). (E and F) MC photoinhibition during ORM learning does not impair task performance (dorsal: n = 10|9; ventral: n = 9|10 for eYFP|eNpHR). (F) MC photoinhibition during ORM testing does not affect task performance (dorsal: n = 10|10; ventral: n = 7|9 for eYFP|eNpHR). Data are presented as mean ± SEM. *P < 0.05; two-tailed Welch’s t test.

Comment in

References

    1. Kwan P, Sander JW. J Neurol Neurosurg Psychiatry. 2004;75:1376–1381. - PMC - PubMed
    1. Blümcke I, et al. Epilepsia. 2000;41(suppl 6):S174–S180. - PubMed
    1. Scharfman HE. Nat Rev Neurosci. 2016;17:562–575. - PMC - PubMed
    1. Ratzliff A, Howard AL, Santhakumar V, Osapay I, Soltesz I. J Neurosci. 2004;24:2259–2269. - PMC - PubMed
    1. Sloviter RS, et al. J Comp Neurol. 2003;459:44–76. - PubMed

Publication types