. 2018 Feb 15;9(1):689.
doi: 10.1038/s41467-018-03106-1.

Systematic analysis of protein turnover in primary cells

Affiliations

Systematic analysis of protein turnover in primary cells

Toby Mathieson et al. Nat Commun. .

Abstract

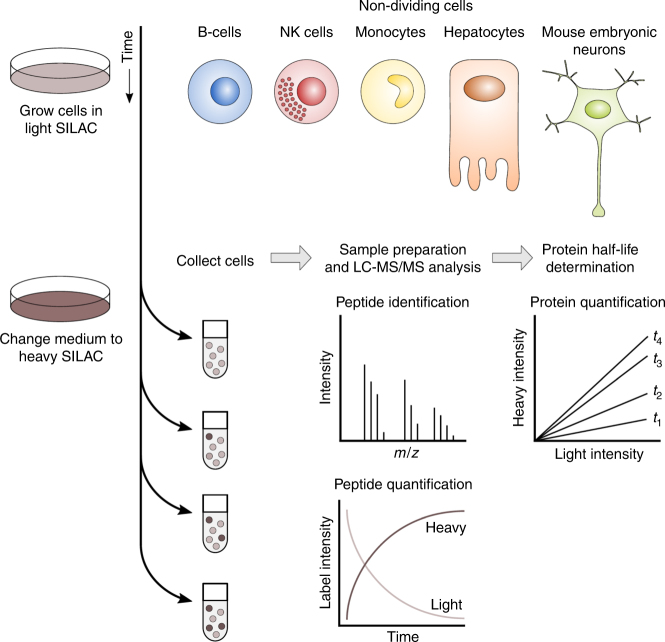
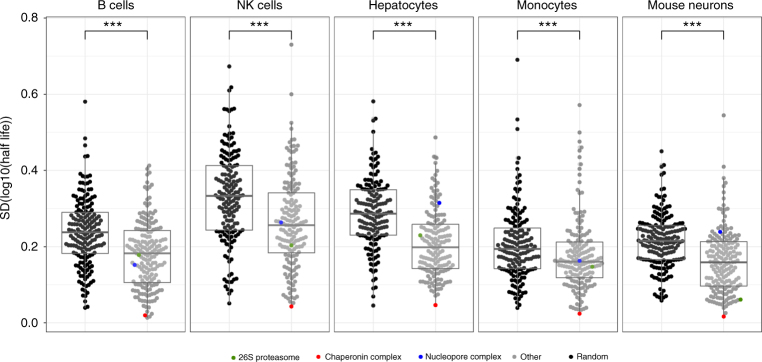
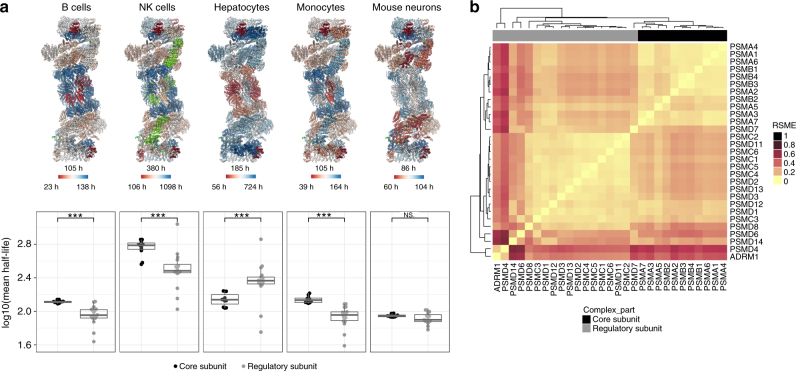
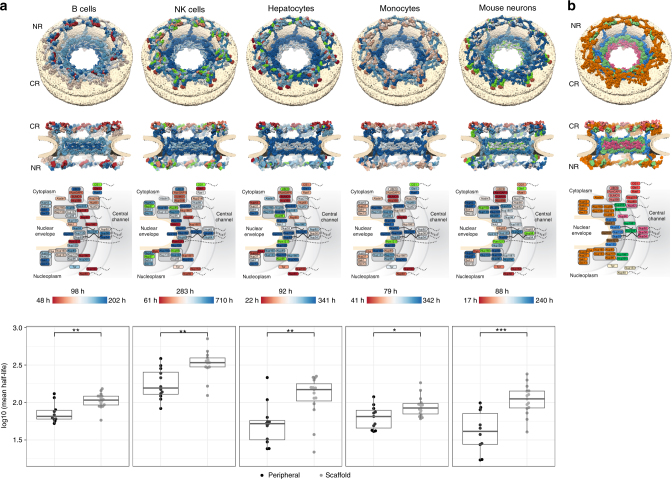
A better understanding of proteostasis in health and disease requires robust methods to determine protein half-lives. Here we improve the precision and accuracy of peptide ion intensity-based quantification, enabling more accurate protein turnover determination in non-dividing cells by dynamic SILAC-based proteomics. This approach allows exact determination of protein half-lives ranging from 10 to >1000 h. We identified 4000-6000 proteins in several non-dividing cell types, corresponding to 9699 unique protein identifications over the entire data set. We observed similar protein half-lives in B-cells, natural killer cells and monocytes, whereas hepatocytes and mouse embryonic neurons show substantial differences. Our data set extends and statistically validates the previous observation that subunits of protein complexes tend to have coherent turnover. Moreover, analysis of different proteasome and nuclear pore complex assemblies suggests that their turnover rate is architecture dependent. These results illustrate that our approach allows investigating protein turnover and its implications in various cell types.


Conflict of interest statement

T.M., G.S., H.F., N.Z., D.P., M.St., G.B. and M.Ba. are employees and/or shareholders of Cellzome GmbH and GlaxoSmithKline. The remaining authors declare no competing financial interests.

Figures

Fig. 1
Fig. 1
Experimental workflow for protein half-life determination using dynamic SILAC and quantitative mass spectrometry. Five non-dividing primary cell types comprising B-cells, NK cells, monocytes, hepatocytes, and mouse embryonic neurons were adapted to light SILAC medium. To label newly synthesized proteins, the cells were exposed to heavy SILAC medium and collected at different time points. After protein extraction, proteolysis with trypsin, sample preparation, and subsequent LC-MS/MS analysis, the peptides were identified by the Mascot database search engine and quantified using the isobarQuant software package. Peptides of pre-existing and newly synthesized proteins were distinguished by their mass due to incorporation of light or heavy arginine and lysine. Protein fold changes at different time points were calculated using the intensity ratios of heavy vs. light SILAC peptides and were used for subsequent protein half-life determination
Fig. 2
Fig. 2
Assessment of protein half-lives in different cell types. a Scatter plots comparing protein half-lives determined in two experiments. On the diagonal the half-lives determined in biological replicate experiments in the same cell type are compared. Red dots indicate nuclear pore complex components. The plots below the diagonal compare the average protein half-lives determined in one cell type against other cell types as indicated. b, c, d Highly reproducible individual peptide fold changes from proteins with very-long half-lives determined from the B-cell experiment. The median protein fold changes are denoted by the slope of the line. The fold changes at the different time points are denoted by the different colors (red, 7 h; gray 11 h; green 24 h, and blue 34 h) with replicate one represented by a solid line and replicate two by a dashed line. The insets on each graph show the heavy and light SILAC intensities plotted on the same scale. b O75367 (Core histone macro-H2A.1, H2AFY) half-life from replicate one/two 945.9/995.9 h. c P16403 (Histone H1.2, gene HIST1H1C) half-life from replicate one/two: 2168.8/2315.5 h. d P20700 (Lamin-B1, gene LMNB1) half-life from replicate one/two: 1479.9/1623.5 h. The same is shown for three nuclear pore complex members (NUPs) as for (b, c, d). e Protein NUP205 has a half-life of 103.3 h in replicate one and 138.9 h in replicate two. f Protein NUP153 (P49790) has the shortest half-life of all the NUPs identified in B-cells with a half-life of 49.8 h in replicate one and 55.1 in replicate two. g Protein NUP107 (P57740) has a half-life of 91.2 h in replicate one and 104.5 h in replicate two
Fig. 3
Fig. 3
Half-life variability among members of protein complexes is smaller than expected by chance. Distributions of standard deviations (SD) of half-lives from proteins in complexes as annotated in the CORUM database compared to SD of the half-lives of the same proteins shuffled across the different complexes, while preserving the number of proteins in each complex group. Differences in the log10 half-lives of true protein complex members vs. the random draws of proteins in a given cell type were assessed by Wilcoxon-rank test (significance levels were encoded as *** p < 0.001, ** p < 0.01, * p < 0.05). Center line in box plots is the median, the bounds of the boxes are the 75 and 25% percentiles i.e., the interquartile range (IQR) and the whiskers correspond to the highest or lowest respective value or if the lowest or highest value is an outlier (greater than 1.5 * IQR from the bounds of the boxes) it is exactly 1.5 * IQR
Fig. 4
Fig. 4
Architecture-dependent turnover of the proteasome subunits. a Upper panel: proteasome subunits are shown color-coded as gradient from red (short half-life) to blue (long half-life). For each cell type, half-lives were averaged over biological replicates, except for rare cases where only one half-life value was available, and converted to a color gradient as explained in the Methods. The median, minimum, and maximum half-lives are indicated together with the color bars. Subunits with undetermined half-lives are colored green. Lower panel: distributions of the reproducibly measured half-lives of the regulatory and the non-exchangeable core subunits of the proteasome in the different cell types. Differences in the distributions of log10 half-lives were assessed by Wilcoxon-rank test (significance levels were encoded as *** p < 0.001, ** p < 0.01, * p < 0.05). Center line in box plots is the median, the bounds of the boxes are the 75 and 25% percentiles i.e., the interquartile range (IQR) and the whiskers correspond to the highest or lowest respective value or if the lowest or highest value is an outlier (greater than 1.5 * IQR from the bounds of the boxes) it is exactly 1.5 * IQR b Heatmap showing the comparison for each pair of proteasome subunits by calculating the root mean square error between their four log10 transformed half-lives in the four different human cell types. Hierarchical clustering leads to separation of the regulatory subunits from the non-exchangeable core subunits. The 19S proteasome subunits PSMD4 and the recently discovered ADRM1 form a distinct cluster
Fig. 5
Fig. 5
Architecture-dependent turnover of the nuclear pore subunits. a Upper panel: nucleoporin half-lives mapped onto the structure of the nuclear pore complex. Nups are shown color-coded as gradient from red (short half-life) to blue (long life-life). An architectural model of the nuclear pore, is shown as seen from top (top panel), cut in half (middle panel), and a subcomplex scheme (bottom panel). The nucleoplasmic side is at the bottom in all cases. For each cell type, half-lives were averaged over two biological replicates, except for rare cases where only one half-life value was available, and converted to a color gradient as explained in the Methods. The median and minimum and maximum half-lives are indicated together with the color bars. Nups with non-determined half-lives are colored green. Lower panel: distributions of the reproducibly measured half-lives of the scaffold and peripheral subunits of the nuclear pore in the different cell types. Differences in the distributions of log10 half-lives were assessed by Wilcoxon-rank test (significance levels were encoded as *** p < 0.001, ** p < 0.01, * p < 0.05). Center line in box plots is the median, the bounds of the boxes are the 75 and 25% percentiles i.e., the interquartile range (IQR), and the whiskers correspond to the highest or lowest respective value or if the lowest or highest value is an outlier (greater than 1.5 * IQR from the bounds of the boxes) it is exactly 1.5 * IQR b The same as upper panel in (a), but color-coded according to Nup subcomplexes. Nups of the inner ring are colored blue, of the outer (Y-complex) rings—orange, trans-membrane nucleoporins—brown, Nup205 and Nup188—green, nuclear basket nucleoporins—yellow, Nup62 subcomplex—magenta, Nup358 subcomplex—salmon, and Nup214 complex—red

References

    1. Cox J, Mann M. Quantitative, high-resolution proteomics for data-driven systems biology. Annu. Rev. Biochem. 2011;80:273–299. doi: 10.1146/annurev-biochem-061308-093216. - DOI - PubMed
    1. Geiger T, Wehner A, Schaab C, Cox J, Mann M. Comparative proteomic analysis of eleven common cell lines reveals ubiquitous but varying expression of most proteins. Mol. Cell. Proteom. 2012;11:M111 014050. doi: 10.1074/mcp.M111.014050. - DOI - PMC - PubMed
    1. Savitski MM, et al. Tracking cancer drugs in living cells by thermal profiling of the proteome. Science. 2014;346:1255784. doi: 10.1126/science.1255784. - DOI - PubMed
    1. Bantscheff M, et al. Quantitative chemical proteomics reveals mechanisms of action of clinical ABL kinase inhibitors. Nat. Biotechnol. 2007;25:1035–1044. doi: 10.1038/nbt1328. - DOI - PubMed
    1. Francavilla C, et al. Multilayered proteomics reveals molecular switches dictating ligand-dependent EGFR trafficking. Nat. Struct. Mol. Biol. 2016;23:608–618. doi: 10.1038/nsmb.3218. - DOI - PMC - PubMed