. 2018 Feb 15;8(1):3064.
doi: 10.1038/s41598-018-21403-z.

Measurements of complex refractive index change of photoactive yellow protein over a wide wavelength range using hyperspectral quantitative phase imaging

Affiliations

Measurements of complex refractive index change of photoactive yellow protein over a wide wavelength range using hyperspectral quantitative phase imaging

KyeoReh Lee et al. Sci Rep. .

Abstract

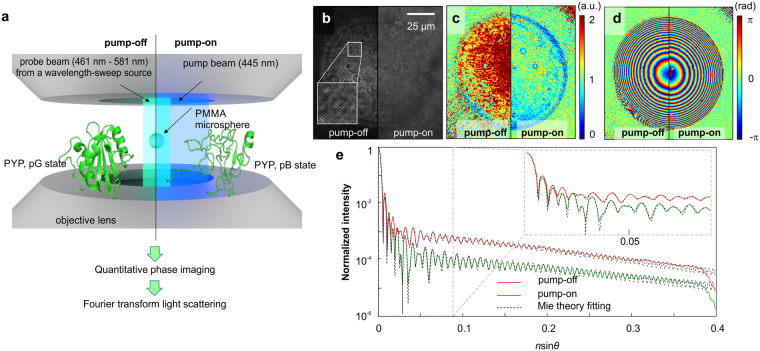
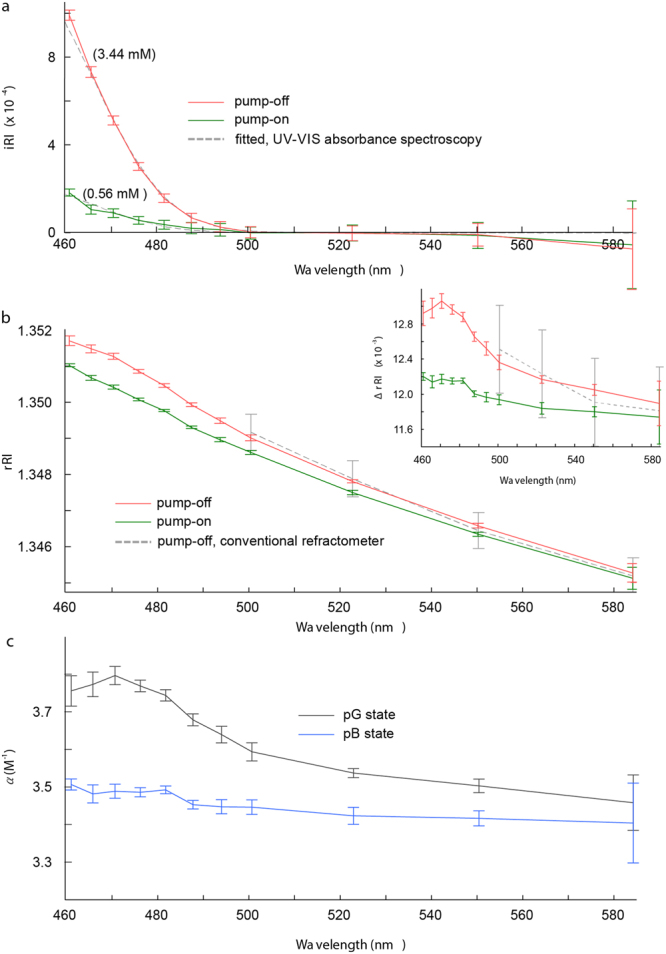
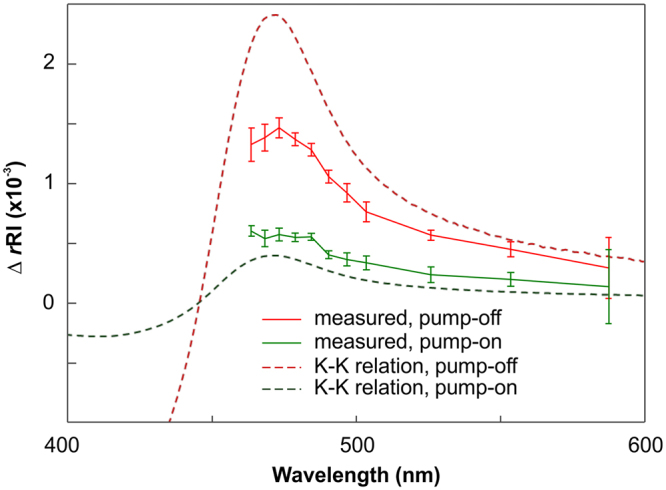
A novel optical holographic technique is presented to simultaneously measure both the real and imaginary components of the complex refractive index (CRI) of a protein solution over a wide visible wavelength range. Quantitative phase imaging was employed to precisely measure the optical field transmitted from a protein solution, from which the CRIs of the protein solution were retrieved using the Fourier light scattering technique. Using this method, we characterized the CRIs of the two dominant structural states of a photoactive yellow protein solution over a broad wavelength range (461-582 nm). The significant CRI deviation between the two structural states was quantified and analysed. The results of both states show the similar overall shape of the expected rRI obtained from the Kramers-Kronig relations.


Conflict of interest statement

The authors declare no competing interests.

Figures

Figure 1
Figure 1
Experimental procedure for measuring the CRI of PYP solution. (a) A conceptual schematic of the measurements. The optical field of a microsphere immersed in PYP solution is obtained over a broad range of visible wavelengths; left, in the absence of a pump beam (pump-off); right, in the presence of a pump beam (pump-on), where most PYP converts to the excited state (pB). (b) Raw hologram of a PYP solution without (left) and with (right) the pump beam. (c) Measured amplitude and (d) phase images of microspheres immersed in the PYP solution. (e) Retrieved FTLS results of the PYP solution in pump-off (red) and pump-on (green) cases. The solid and dotted lines represent the experimental results and theoretical (Mie theory) fitting, respectively. Inset, FLTS results within the smaller scattering angle range.
Figure 2
Figure 2
Measured CRI and refractive index increment of PYP solution. (a) The red line represents the iRI value of the PYP solution in the absence of pump beam illumination (pump-off). The green line represents the iRI value of the PYP solution in the presence of pump beam illumination (pump-on). The grey dotted line represents the fitted graphs of both of these values, based on Eq. (2). Corresponding concentrations of the ground state PYP are indicated in brackets on each line. (b) The rRI values of the PYP solution in the pump-off (red) and pump-on (green) environments. The grey dotted line represents the rRI result for a pump-off PYP solution obtained from a conventional refractometer for comparison. The inset shows the result after subtracting the rRI of distilled water from the PYP solution. (c) Refractive index increment (α) of pG (black) and pB (blue) states. The error bars indicate the standard deviation from five measurements with different microspheres immersed in identical PYP solutions.
Figure 3
Figure 3
Comparison between calculated ΔrRI trends of the PYP based on the K–K relations (dotted lines) and measurements (solid lines). The solid lines are identical to the inset in Fig. 2b. The red and green curves indicate the case in the absence (pump-off) and the presence (pump-on) of the pump beam, respectively. The y-axis offset of the dotted lines is set discretionarily because of the ambiguity arising from the integral forms of the K–K relations.

References

    1. Bailey RC, Nam J-M, Mirkin CA, Hupp JT. Real-time multicolor DNA detection with chemoresponsive diffraction gratings and nanoparticle probes. Journal of the American Chemical Society. 2003;125:13541–13547. doi: 10.1021/ja035479k. - DOI - PubMed
    1. Löper P, et al. Complex refractive index spectra of CH3NH3PbI3 perovskite thin films determined by spectroscopic ellipsometry and spectrophotometry. J. Phys. Chem. Lett. 2015;6:66–71. doi: 10.1021/jz502471h. - DOI - PubMed
    1. Saha S, Sinha T, Mookerjee A. Electronic structure, chemical bonding, and optical properties of paraelectric BaTiO 3. Phys Rev B. 2000;62:8828. doi: 10.1103/PhysRevB.62.8828. - DOI
    1. Kim JY, Hwang MS, Kim Y-H, Kim HJ, Lee Y. Origin of low dielectric constant of carbon-incorporated silicon oxide film deposited by plasma enhanced chemical vapor deposition. Journal of Applied Physics. 2001;90:2469–2473. doi: 10.1063/1.1388861. - DOI
    1. Sokolik I, Andronova A, Johnson TC. Complex refractive index of atmospheric dust aerosols. Atmospheric Environment. Part A. General Topics. 1993;27:2495–2502. doi: 10.1016/0960-1686(93)90021-P. - DOI

Publication types

MeSH terms

Substances