. 2017 Nov;1(11):902-913.
doi: 10.1038/s41551-017-0153-2. Epub 2017 Nov 6.

Macrogenomic engineering via modulation of the scaling of chromatin packing density

Affiliations

Macrogenomic engineering via modulation of the scaling of chromatin packing density

Luay M Almassalha et al. Nat Biomed Eng. 2017 Nov.

Abstract

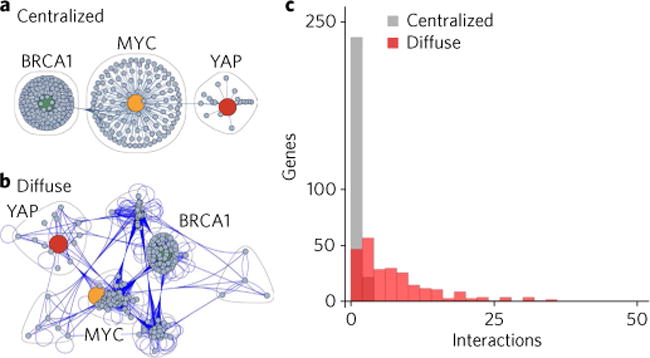
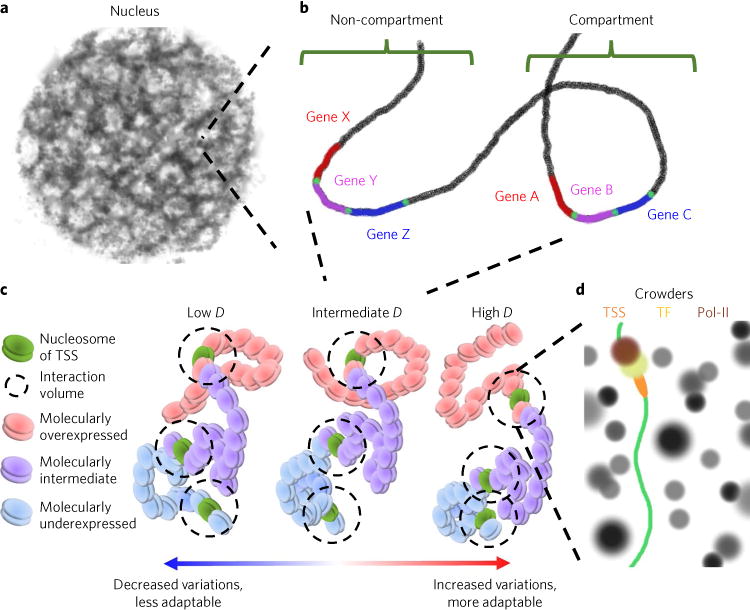
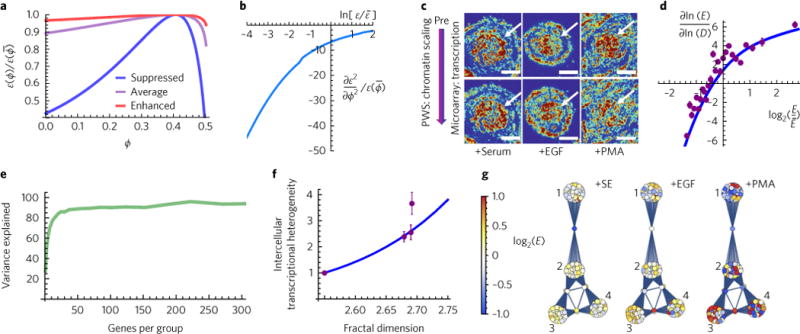
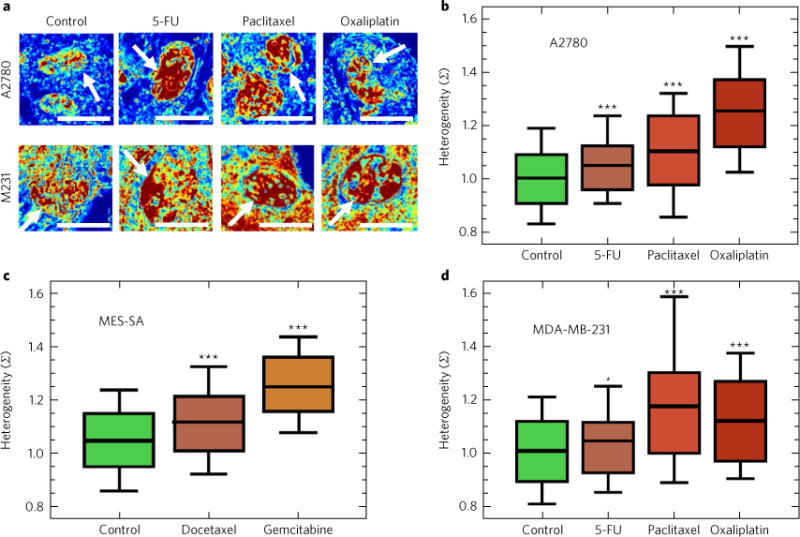
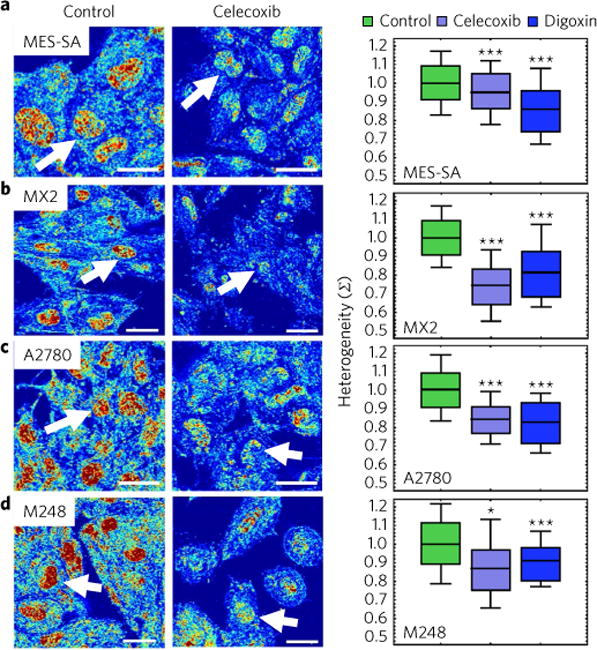
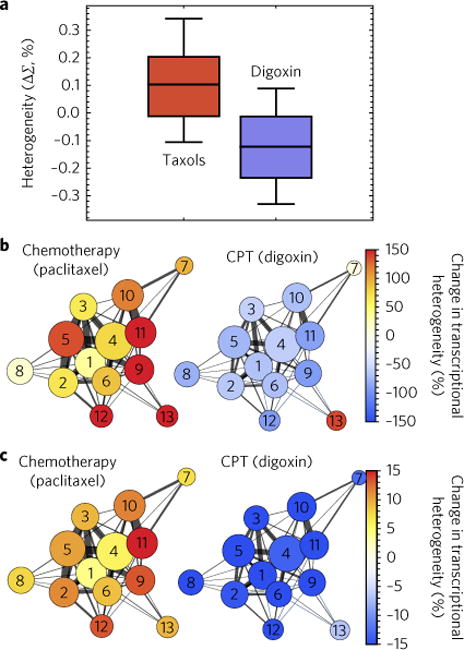
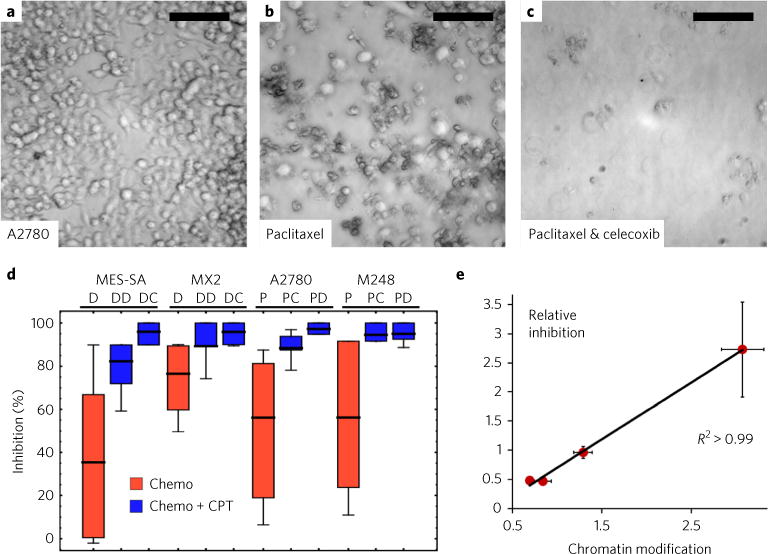
Many human diseases result from the dysregulation of the complex interactions between tens to thousands of genes. However, approaches for the transcriptional modulation of many genes simultaneously in a predictive manner are lacking. Here, through the combination of simulations, systems modelling and in vitro experiments, we provide a physical regulatory framework based on chromatin packing-density heterogeneity for modulating the genomic information space. Because transcriptional interactions are essentially chemical reactions, they depend largely on the local physical nanoenvironment. We show that the regulation of the chromatin nanoenvironment allows for the predictable modulation of global patterns in gene expression. In particular, we show that the rational modulation of chromatin density fluctuations can lead to a decrease in global transcriptional activity and intercellular transcriptional heterogeneity in cancer cells during chemotherapeutic responses to achieve near-complete cancer cell killing in vitro. Our findings represent a 'macrogenomic engineering' approach to modulating the physical structure of chromatin for whole-scale transcriptional modulation.


Conflict of interest statement

Competing interests The authors declare no competing financial interests.

Figures

Fig. 1
Fig. 1. Genomic networks are highly interconnected and decentralized
a, Classically, the role of critical genes, such as MYC, BRCA1 and YAP, has been viewed in the context of a hub-spoke model, in which these genes form the critical link between the elements in the system. b, However, evidence has shown that the full mapping of the interactions that occur for all genes within a given interaction network shows a diffuse plurality of connections and broad network redundancy. c, Mathematically, the divergence in these models can be represented by the number of connections each gene shares. In the classical hub-spoke system, most genes are anchored only by the central elements (such as BRCA1, MYC and YAP). In most genetic networks, however, this is a major oversimplification. Indeed, most genes share direct interactions with at least five other genes within the network, necessitating a strategy to target the overall regulators of gene transcription. In c, note that when grey and red bars overlap, the bar appears dark red.
Fig. 2
Fig. 2. Genomic interactions depend on a complex physical nanoenvironment
a, One universally shared feature of all genes is the physical nanoenvironment that is determined by the supranucleosomal (> 10 nm) packing density of chromatin within the nucleus. b, While previous work has shown that localizing genes into or out of compartments will influence their expression, both genes within compartments (genes A–C) and outside of compartments (genes X–Z) will respond to the physical forces produced by their differential packing density. c, As a consequence, while genes are regulated by distinct molecular characteristics (transcription factor binding affinity, compartment concentrations of factors or nucleosomal modifications) that predispose them to a preferred expression state (overexpressed, intermediate or underexpressed), the transcription of these genes into mRNA will also depend on local physical forces. Thus, regardless of the determinant of expression, overexpressed genes (A and X) will differentially respond to local physical organization produced by chromatin packing when compared to intermediately expressed (B and Y) or underexpressed (C and Z) genes. To integrate these effects, we consider the power-law scaling of chromatin packing density through fractal dimension, D. Increased D produces increased variations in chromatin packing density whereas decreased D does the opposite. d, Ultimately, the physical geometry of chromatin (scaling) determines accessible surface area as well as local crowding conditions that will influence the chemical reactions governing transcription by altering gene accessibility, molecular mobility of reactant species, and the free energy of the transcriptional reactions. Pol-II, RNA polymerase II; TF, transcription factor; TSS, transcription start site.
Fig. 3
Fig. 3. Control of higher-order chromatin packing density scaling allows manipulation of genomic information space
a, Local macromolecular crowding density (ϕ) non-monotonically regulates gene expression. The rate of expression (ε(m,ϕ¯)) relative to that of the average crowding that would be observed in the absence of chromatin packing-density heterogeneity (ε(m,ϕ¯)withϕ¯=40%) is a non-monotonic function of ϕ and also depends on ε(m,ϕ¯). In turn, ε(m,ϕ¯) is determined by molecular factors m including transcription-factor concentrations, binding affinities and the rate of transcription, among others. Expression of suppressed genes is 0.01-fold of the average, and that of enhanced genes is 10-fold the average. b, The result of this non-monotonic relationship between macromolecular crowding and gene expression is an anisotropic response of the rate of expression to changes in crowding (ε2(m,ϕ)ϕ2/ε(m,ϕ¯)) as a function of the rate of expression ε(m,ϕ¯) where ε¯ is the average rate of expression. c, Differential PWS microscopy of the variations in chromatin packing density and RNA microarray experiment to measure the relation between changes in chromatin packing-density scaling and transformation of global gene expression using stimulation with serum (SE), epidermal growth factor (EGF), or phorbal 12-myristate-13-acetate (PMA). Scale bars, 15 μm. Pseudo-colour: heterogeneity of chromatin packing density (Σ). Arrows: cell nuclei. d, Comparison of the analytical macrogenomic model predicting the changes in gene expression in response to changes in chromatin packing-density scaling (fractal dimension) D (blue curve; gene expression sensitivity (Se), see equation (5)), with experimental microarray results (purple markers) obtained from c. Each experimental data point represents the average of 100 genes. F¯ is the average expression of all genes. Error bars are the standard errors of the gene expression sensitivity (Se) calculated based on the microarray data in each subgroup. e, The accuracy of the macrogenomic model (equation (5)) increases as a function of the number of genes in each group. For gene groups with more than 50 genes, over 90% of the variance of gene expression is explained by the predicted effect of the chromatin packing-density scaling. f,g, A major functional role of the regulation of chromatin packing-density scaling is the modulation of the genomic information. Increases in the variations in chromatin packing density are directly linked to increased intercellular transcriptional heterogeneity (f) and transcriptional divergence (g). f, Comparison of the analytical macrogenomic model predicting intercellular transcriptional heterogeneity (H) as a function of D (blue curve; equation (6)) with experimental microarray results (purple markers). Error bars represent the standard errors of the heterogeneity of 1,000 genes for each condition. Genes were selected such that their expression was within 1 standard deviation of gene expression of the mean expression for all conditions. g, Processes where transcriptional divergence occurs include but are not limited to: (1) metabolic regulators, (2) proliferation, (3) apoptosis and (4) developmental regulation.
Fig. 4
Fig. 4. Chemotherapeutic stress increases variations in chromatin packing density
a, Representative PWS microscopy images of cell nuclei before and 72 (5-FU) or 48 (paclitaxel and oxaliplatin) hours after their exposure to cytotoxic chemotherapy for A2780 and MDA-MB-231 (M231) cells. Scale bars, 15 μm. Pseudo-colour: heterogeneity of chromatin packing density (Σ). Arrows: cell nuclei. bd, Treatment of ovarian A2780 cells (P =  2.5 ×  10−4, 1.9 ×  10−7 and 2.8 ×  10−28) (b), uterine leiomyosarcoma MES-SA cells (P =  2.1 ×  10−6 and 1.1 ×  10−19) (c), and triple-negative breast cancer MDA-MB-231 cells (P =  2.5 ×  10−2, 1.6 ×  10−4 and 3.9 ×  10−5) (d) with cytotoxic chemotherapeutic agents (5-FU, paclitaxel and oxaliplatin) produces an increase in the intranuclear chromatin packing-density heterogeneity (Σ), independent of the mechanism of cytotoxic action. Significance was determined using Student’s t-test with unpaired, unequal variance on the average nuclear Σ normalized by the average Σ of the accompanying control group between the conditions. Box represents the 25–75% range of values and whisker represents the 10–90% range around the mean for N =  823 control, 145 5-FU, 132 paclitaxel and 101 oxaliplatin A2780 cells; N =  836 control, 102 docetaxel and 69 gemcitabine MES-SA cells; and N =  264 control, 81 5-FU, 36 paclitaxel and 59 oxaliplatin MDA-MB-231 cells (***P <  0.001, *P <  0.05).
Fig. 5
Fig. 5. Chromatin protective agents rapidly decrease the spatial variations in chromatin packing density
ad, Representative PWS images (left) and quantification (right) of the effects of CPT agents on the variations of chromatin packing density for MES-SA (a), MES-SA. MX2 (MX2) (b), A2780 (c) and A2780.M248 (M248) (d) cells. Notably, variations of chromatin packing density for each cell line model have a differential response to CPT agents celecoxib (P =  3.9 ×  10−34, 1.5 ×  10−53, 1.5 ×  10−30 and 1.3  ×  10−3 for MES-SA, MX2, A2780 and M248 cells, respectively) and digoxin (P  =  2.7 ×  10−8, 7.6 ×  10−69, 3.1 ×  10−36 and 6.2 ×  10−9 for MES-SA, MX2, A2780 and M248 cells, respectively). Significance was determined using Student’s t-test with unpaired, unequal variance on the average nuclear Σ normalized by the average Σ of the accompanying control group between the conditions. Box represents the 25–75% range and whisker represents the 10–90% range of values around the mean for N =  836 control, 275 celecoxib and 342 digoxin MES-SA cells; N  =  558 control, 216 celecoxib and 252 digoxin MX2 cells; N =  823 control, 132 celecoxib and 130 digoxin A2780 cells; and N =  525 control, 36 celecoxib and 91 digoxin M248 cells (***P <  0.001, *P  <  0.05). Scale bars, 15 μm. Pseudo-colour: heterogeneity of chromatin packing density (Σ). Arrows: cell nuclei.
Fig. 6
Fig. 6. Regulation of chromatin packing-density scaling modulates transcriptional heterogeneity
a, Comparison of the alterations in the variations of chromatin packing density due to taxol treatment (paclitaxel or docetaxel) in contrast to CPT agent digoxin for five cell line models (A2780, M248, MDA-MB-231, MES-SA and MX2). Notably, chemotherapeutic intervention produces increased variations in chromatin packing density whereas a CPT agent (digoxin) decreases variations in chromatin packing density. Box represents the 25–75% range and whisker represents the 10–90% range of values around the mean for N =  401 taxol-treated cells (132 A2780, 25 M248, 102 MES-SA, 106 MX2 and 36 MDA-MB-231 cells) and N =  815 digoxin-treated cells (130 A2780, 91 M248, 342 MES-SA and 252 MX2 cells). b,c, As expected, intercellular (b) and intra-network (c) transcriptional heterogeneity increases in cells treated with the chemotherapy agent and decreases in cells treated with the CPT agent for critical biological processes, including: (1) cell cycle, (2) apoptosis, (3) proliferation, (4) transcription, (5) signalling, (6) differentiation, (7) glycolysis, (8) translation, (9) ion transport, (10) metabolism, (11) oxidation/reduction, (12) stress response and (13) nucleosome assembly. Circle size represents the number of each genes belonging to a functional network/process and thickness the number of shared genes. Colour intensity represents the percentage change in transcriptional heterogeneity in paclitaxel-treated versus controls and in digoxin-treated cells versus controls (see the sections ‘RNA-Seq transcriptional analysis’, ‘Intranetwork transcriptional heterogeneity’ and ‘Intercellular transcriptional heterogeneity’ in the Methods for calculations).
Fig. 7
Fig. 7. Rapid modulation of chromatin packing density scaling by CPT agents greatly enhances chemotherapeutic efficacy
ac, Representative images of untreated A2780 cells (a) grown for the same duration as cells treated with 5 nM paclitaxel (b) and cells co-treated with paclitaxel and celecoxib (c). Scale bars, 100 μm. d, Reduction of the scaling of chromatin packing density by CPT agents is directly linked to chemotherapeutic efficacy independent of cell line model and the primary molecular mechanism of action of the chemotherapy and the CPT compounds. D, docetaxel; DD, docetaxel +  digoxin; DC, docetaxel +  celecoxib; P, paclitaxel; PC, paclitaxel +  celecoxib; PD, paclitaxel +  digoxin. The mean was calculated from N =  45 D, 45 DD and 45 DC (MES-SA cells); N =  30 D, 30 DD and 30 DC (MX2); N =  60 P, 30 PC and 30 PD (A2780); and N =  60 P, 30 PC and 30 PD (M248) individual measurements of cell density per low-power field (410  μm2) for each condition, normalized by the average cell density per low-power field of the accompanying control group. Box represents the 25–75% range and whisker represents the 10–90% range of values around the mean. e, Relative elimination of cancer cells due to the co-treatment with chemotherapy and adjuvant CPT compounds versus the chemotherapy mono-treatment (relative inhibition) is strongly correlated to the efficacy of the CPT compounds to reduce chromatin packing-density scaling (chromatin modification) (R2 >  0.99). Relative inhibition was calculated by measuring the effective difference between the two CPT agents when paired with chemotherapy normalized by the therapeutic efficacy of chemotherapy alone (see ‘Viability analysis’ in the Methods for details).

References

    1. Collins FS. Shattuck lecture—medical and societal consequences of the Human Genome Project. N Engl J Med. 1999;341:28–37. - PubMed
    1. Bailey JN, Pericak-Vance MA, Haines JL. The impact of the human genome project on complex disease. Genes. 2014;5:518–535. - PMC - PubMed
    1. Forbes SA, et al. COSMIC: exploring the world’s knowledge of somatic mutations in human cancer. Nucleic Acids Res. 2015;43:805–811. - PMC - PubMed
    1. Iwafuchi-Doi M, Zaret KS. Pioneer transcription factors in cell reprogramming. Genes Dev. 2014;28:2679–2692. - PMC - PubMed
    1. Zhang Z, Pugh BF. High-resolution genome-wide mapping of the primary structure of chromatin. Cell. 2011;144:175–186. - PMC - PubMed

LinkOut - more resources