

CD44v6 increases gastric cancer malignant phenotype by modulating adipose stromal cell-mediated ECM remodeling
- PMID: 29450424
- PMCID: PMC5988203
- DOI: 10.1039/c7ib00179g
CD44v6 increases gastric cancer malignant phenotype by modulating adipose stromal cell-mediated ECM remodeling
Abstract
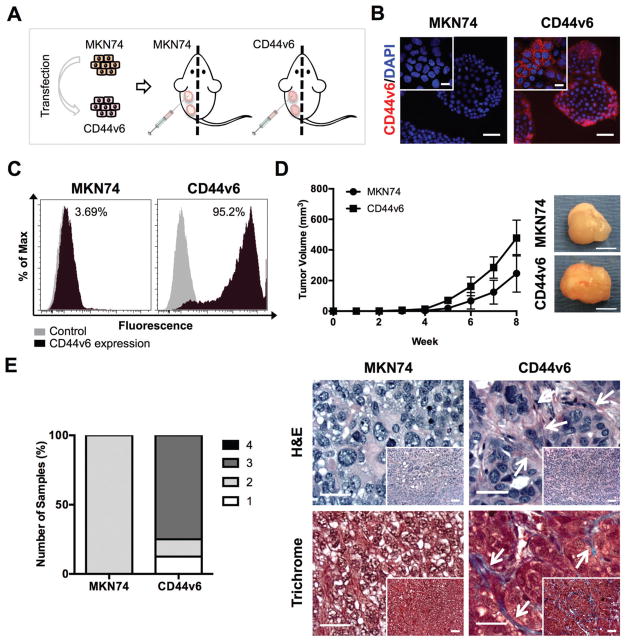
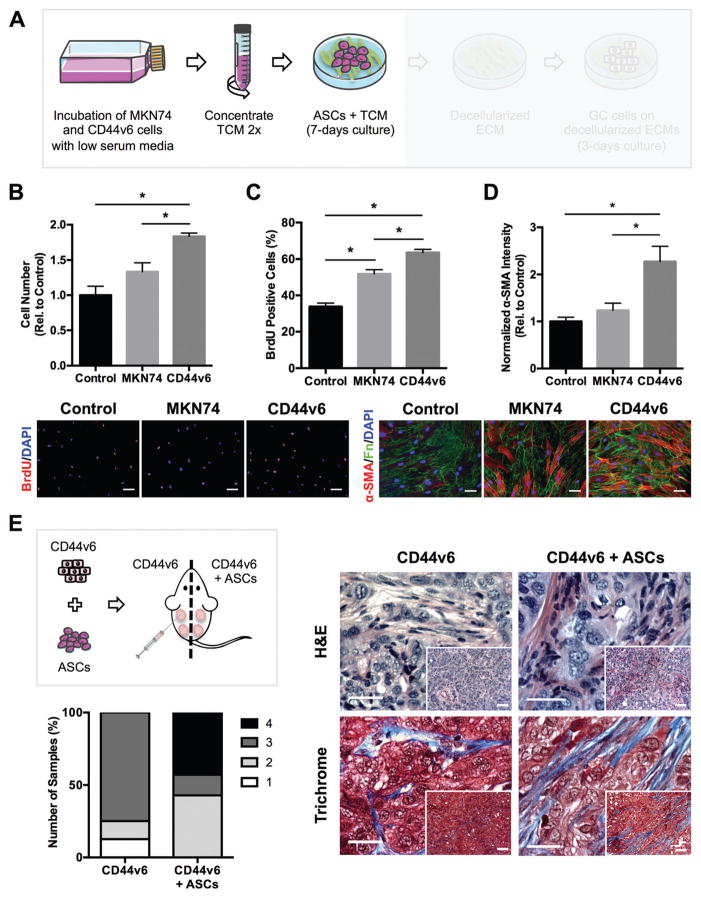
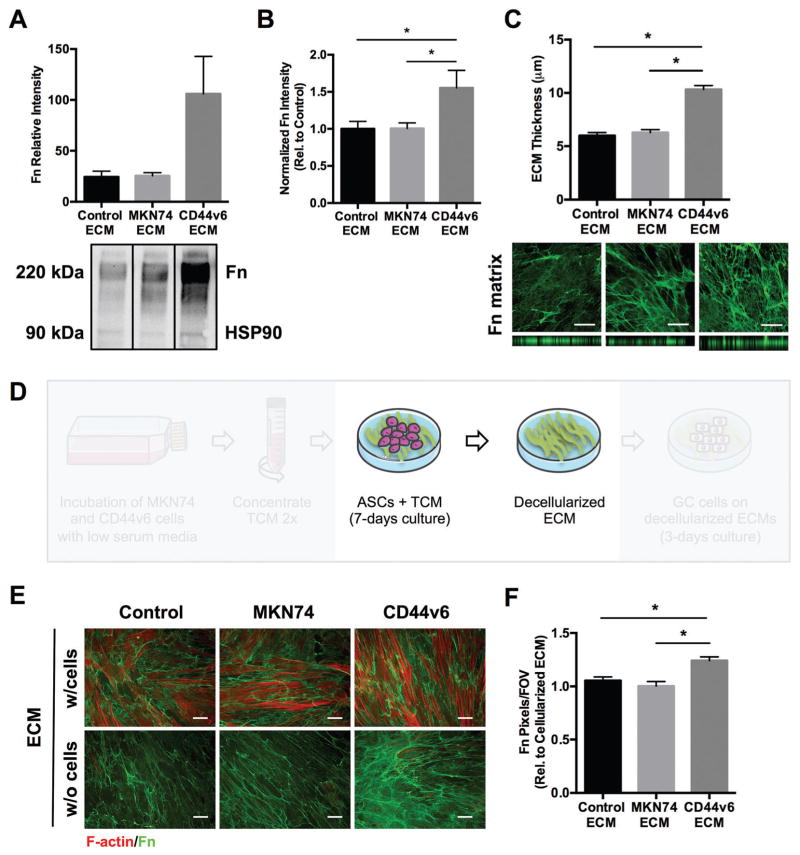
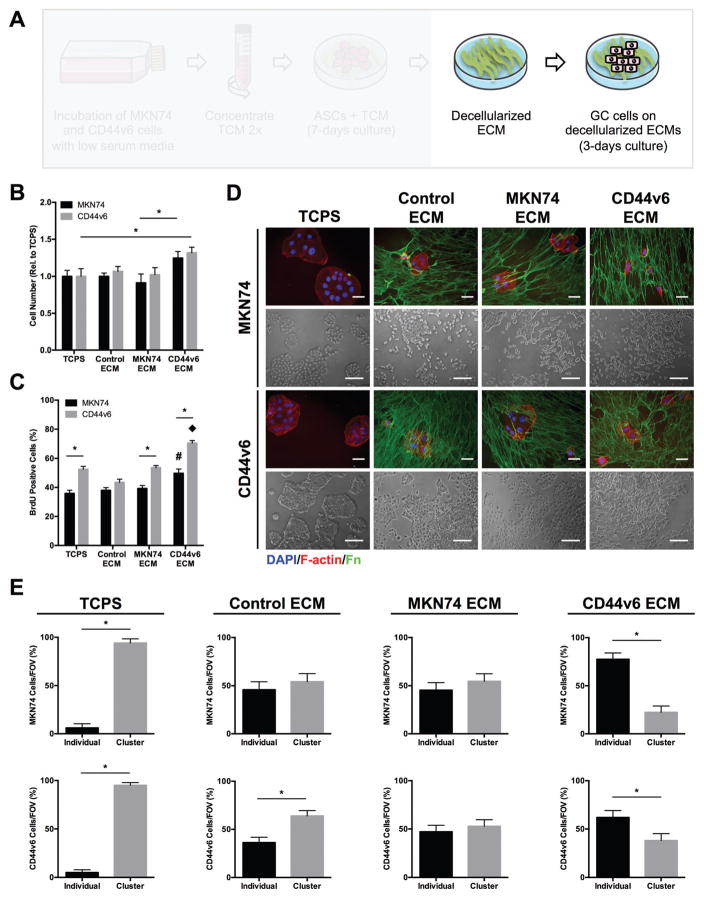
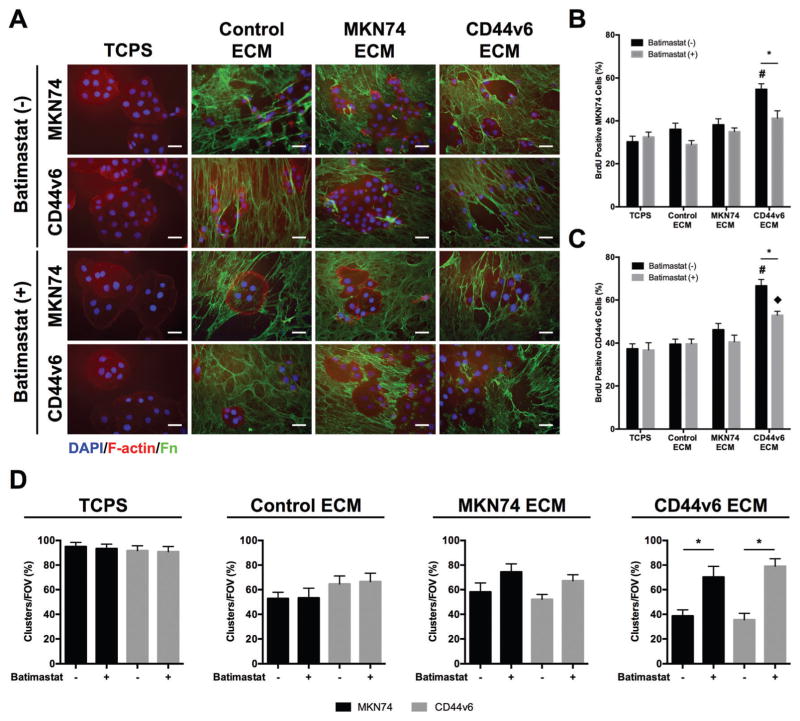
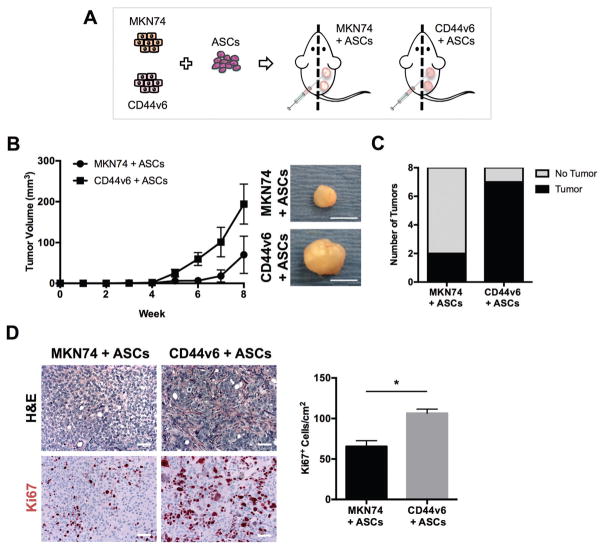
CD44, an abundantly expressed adhesion molecule, and its alternative splice variants have been associated with tumorigenesis and metastasis. In the context of gastric cancer (GC), de novo expression of CD44 variant 6 (CD44v6) is found in more than 60% of GCs, but its role in the pathogenesis and progression of this type of cancer remains unclear. Using a combination of media conditioning experiments and decellularized extracellular matrices (ECMs), this study investigates the hypothesis that CD44v6 overexpression enhances tumor cell malignant behavior by modulating stromal cell-mediated ECM remodeling. Our findings indicate that soluble factors secreted by CD44v6 expressing GC cells particularly increase proliferation and myofibroblastic differentiation of adipose stromal cells (ASCs). These changes in ASC phenotype mediate the deposition of fibrotic/desmoplastic ECM that, in turn, stimulates GC proliferation and inhibits GC clustering. Pharmacological inhibition of matrix metalloproteinase (MMP) activity in tumor cells abrogated matrix-induced changes in tumor cell malignant behavior. Additionally, studies in mice confirmed the pathological relevance of CD44v6 expression and consequential changes in ECM remodeling to gastric tumorigenesis in vivo. Collectively, these results indicate a direct link between CD44v6, ECM remodeling, and GC malignant behavior opening new insights into potential CD44v6-targeted therapies.
Conflict of interest statement
The authors declare no conflict of interest.
Figures
Similar articles
-
Regulation of CD44v6 expression in gastric carcinoma by the IL-6/STAT3 signaling pathway and its clinical significance.Oncotarget. 2017 Jul 11;8(28):45848-45861. doi: 10.18632/oncotarget.17435. Oncotarget. 2017. PMID: 28507278 Free PMC article.
-
CD44 alternative splicing in gastric cancer cells is regulated by culture dimensionality and matrix stiffness.Biomaterials. 2016 Aug;98:152-62. doi: 10.1016/j.biomaterials.2016.04.016. Epub 2016 May 3. Biomaterials. 2016. PMID: 27187279
-
LncRNA CCAT2 promotes malignant progression of metastatic gastric cancer through regulating CD44 alternative splicing.Cell Oncol (Dordr). 2023 Dec;46(6):1675-1690. doi: 10.1007/s13402-023-00835-4. Epub 2023 Jun 24. Cell Oncol (Dordr). 2023. PMID: 37354353
-
89Zr-N-Succinyldesferal-anti-CD44v6 chimeric monoclonal antibody U36.2010 Mar 25 [updated 2010 Apr 22]. In: Molecular Imaging and Contrast Agent Database (MICAD) [Internet]. Bethesda (MD): National Center for Biotechnology Information (US); 2004–2013. 2010 Mar 25 [updated 2010 Apr 22]. In: Molecular Imaging and Contrast Agent Database (MICAD) [Internet]. Bethesda (MD): National Center for Biotechnology Information (US); 2004–2013. PMID: 20641988 Free Books & Documents. Review.
-
124I-Anti-CD44v6 chimeric monoclonal antibody U36.2007 Oct 5 [updated 2007 Nov 19]. In: Molecular Imaging and Contrast Agent Database (MICAD) [Internet]. Bethesda (MD): National Center for Biotechnology Information (US); 2004–2013. 2007 Oct 5 [updated 2007 Nov 19]. In: Molecular Imaging and Contrast Agent Database (MICAD) [Internet]. Bethesda (MD): National Center for Biotechnology Information (US); 2004–2013. PMID: 20641377 Free Books & Documents. Review.
Cited by
-
Redox signaling-mediated tumor extracellular matrix remodeling: pleiotropic regulatory mechanisms.Cell Oncol (Dordr). 2024 Apr;47(2):429-445. doi: 10.1007/s13402-023-00884-9. Epub 2023 Oct 4. Cell Oncol (Dordr). 2024. PMID: 37792154 Review.
-
Hydroxyapatite mineral enhances malignant potential in a tissue-engineered model of ductal carcinoma in situ (DCIS).Biomaterials. 2019 Dec;224:119489. doi: 10.1016/j.biomaterials.2019.119489. Epub 2019 Sep 11. Biomaterials. 2019. PMID: 31546097 Free PMC article.
-
Phosphoproteomic Changes Induced by Cell-Derived Matrix and Their Effect on Tumor Cell Migration and Cytoskeleton Remodeling.ACS Biomater Sci Eng. 2023 Dec 11;9(12):6835-6848. doi: 10.1021/acsbiomaterials.3c01034. Epub 2023 Nov 28. ACS Biomater Sci Eng. 2023. PMID: 38015076 Free PMC article.
-
CD44: A Multifunctional Mediator of Cancer Progression.Biomolecules. 2021 Dec 9;11(12):1850. doi: 10.3390/biom11121850. Biomolecules. 2021. PMID: 34944493 Free PMC article. Review.
-
CD44v6, STn & O-GD2: promising tumor associated antigens paving the way for new targeted cancer therapies.Front Immunol. 2023 Oct 3;14:1272681. doi: 10.3389/fimmu.2023.1272681. eCollection 2023. Front Immunol. 2023. PMID: 37854601 Free PMC article. Review.
References
-
- Torre LA, Bray F, Siegel RL, Ferlay J, Lortet-Tieulent J, Jemal A. Ca-Cancer J Clin. 2015;65:87–108. - PubMed
-
- Cunningham D, Allum WH, Stenning SP, Thompson JN, Van de Velde CJ, Nicolson M, Scarffe JH, Lofts FJ, Falk SJ, Iveson TJ, Smith DB, Langley RE, Verma M, Weeden S, Chua YJ, Participants MT. N Engl J Med. 2006;355:11–20. - PubMed
-
- Orian-Rousseau V. Eur J Cancer. 2010;46:1271–1277. - PubMed
-
- Louderbough JM, Schroeder JA. Mol Cancer Res. 2011;9:1573–1586. - PubMed
-
- Ponta H, Sherman L, Herrlich PA. Nat Rev Mol Cell Biol. 2003;4:33–45. - PubMed
Publication types
MeSH terms
Substances
Grants and funding
LinkOut - more resources
Full Text Sources
Other Literature Sources
Medical
Miscellaneous
