Clinical Age-Specific Seasonal Conjunctivitis Patterns and Their Online Detection in Twitter, Blog, Forum, and Comment Social Media Posts
- PMID: 29450538
- PMCID: PMC5815847
- DOI: 10.1167/iovs.17-22818
Clinical Age-Specific Seasonal Conjunctivitis Patterns and Their Online Detection in Twitter, Blog, Forum, and Comment Social Media Posts
Abstract
Purpose: We sought to determine whether big data from social media might reveal seasonal trends of conjunctivitis, most forms of which are nonreportable.
Methods: Social media posts (from Twitter, and from online forums and blogs) were classified by age and by conjunctivitis type (allergic or infectious) using Boolean and machine learning methods. Based on spline smoothing, we estimated the circular mean occurrence time (a measure of central tendency for occurrence) and the circular variance (a measure of uniformity of occurrence throughout the year, providing an index of seasonality). Clinical records from a large tertiary care provider were analyzed in a similar way for comparison.
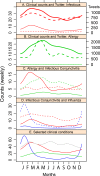
Results: Social media posts machine-coded as being related to infectious conjunctivitis showed similar times of occurrence and degree of seasonality to clinical infectious cases, and likewise for machine-coded allergic conjunctivitis posts compared to clinical allergic cases. Allergic conjunctivitis showed a distinctively different seasonal pattern than infectious conjunctivitis, with a mean occurrence time later in the spring. Infectious conjunctivitis for children showed markedly greater seasonality than for adults, though the occurrence times were similar; no such difference for allergic conjunctivitis was seen.
Conclusions: Social media posts broadly track the seasonal occurrence of allergic and infectious conjunctivitis, and may be a useful supplement for epidemiologic monitoring.
Figures


Similar articles
-
Surveillance Tools Emerging From Search Engines and Social Media Data for Determining Eye Disease Patterns.JAMA Ophthalmol. 2016 Sep 1;134(9):1024-30. doi: 10.1001/jamaophthalmol.2016.2267. JAMA Ophthalmol. 2016. PMID: 27416554 Free PMC article.
-
ICDTag: a prototype for a web-based system for organizing physician-written blog posts using a hybrid taxonomy-folksonomy approach.J Med Internet Res. 2013 Feb 27;15(2):e41. doi: 10.2196/jmir.2353. J Med Internet Res. 2013. PMID: 23470419 Free PMC article.
-
Do general practitioners adhere to the guideline on infectious conjunctivitis? Results of the Second Dutch National Survey of General Practice.BMC Fam Pract. 2007 Sep 16;8:54. doi: 10.1186/1471-2296-8-54. BMC Fam Pract. 2007. PMID: 17868475 Free PMC article.
-
Does This Patient With Acute Infectious Conjunctivitis Have a Bacterial Infection?: The Rational Clinical Examination Systematic Review.JAMA. 2022 Jun 14;327(22):2231-2237. doi: 10.1001/jama.2022.7687. JAMA. 2022. PMID: 35699701
-
Epidemiology of allergic conjunctivitis: clinical appearance and treatment patterns in a population-based study.Curr Opin Allergy Clin Immunol. 2015 Oct;15(5):482-8. doi: 10.1097/ACI.0000000000000204. Curr Opin Allergy Clin Immunol. 2015. PMID: 26258920 Review.
Cited by
-
Estimating the Incidence of Conjunctivitis by Comparing the Frequency of Google Search Terms With Clinical Data: Retrospective Study.JMIR Public Health Surveill. 2021 Mar 3;7(3):e22645. doi: 10.2196/22645. JMIR Public Health Surveill. 2021. PMID: 33656450 Free PMC article.
-
A Google Trends Approach to Identify Distinct Diurnal and Day-of-Week Web-Based Search Patterns Related to Conjunctivitis and Other Common Eye Conditions: Infodemiology Study.J Med Internet Res. 2022 Jul 5;24(7):e27310. doi: 10.2196/27310. J Med Internet Res. 2022. PMID: 35537041 Free PMC article.
-
Seasonal and Temporal Trends in Childhood Conjunctivitis in Burkina Faso.Am J Trop Med Hyg. 2018 Jul;99(1):229-232. doi: 10.4269/ajtmh.17-0642. Epub 2018 May 10. Am J Trop Med Hyg. 2018. PMID: 29761759 Free PMC article.
-
Ophthalmology residency programs on social media.Int Ophthalmol. 2023 Dec;43(12):4815-4819. doi: 10.1007/s10792-023-02883-z. Epub 2023 Oct 17. Int Ophthalmol. 2023. PMID: 37845579
-
Qualitative Content Analysis of Type 1 Diabetes Caregiver Blogs and Correlations With Caregiver Challenges and Successes.J Patient Exp. 2020 Dec;7(6):957-963. doi: 10.1177/2374373520975726. Epub 2020 Nov 25. J Patient Exp. 2020. PMID: 33457528 Free PMC article.
References
-
- Brownstein JS, Freifeld CC. . HealthMap: the development of automated real-time internet surveillance for epidemic intelligence. Euro Surveill. 2007; 12:E071129.5. - PubMed
-
- Madan A, Cebrian M, Lazer D, Pentland A. . Social sensing for epidemiological behavior change. Proc ACM Int Conf Ubiquitous Comput. 2010: 291– 300.
-
- Khan K, McNabb SJN, Memish ZA,et al. . Infectious disease surveillance and modelling across geographic frontiers and scientific specialties. Lancet Infect Dis. 2012; 12: 222– 230. - PubMed
-
- Sadilek A, Kautz H, Bigham JP. . Modeling the interplay of people's location, interactions, and social ties. : Proceedings of the Twenty-Third International Joint Conference on Artificial Intelligence. Beijing, China: AAAI Press; 2013: 3067– 3071.
Publication types
MeSH terms
Grants and funding
LinkOut - more resources
Full Text Sources
Other Literature Sources
Molecular Biology Databases

