. 2018 Jul;66(7):1346-1362.
doi: 10.1002/glia.23308. Epub 2018 Feb 16.

MicroRNA-365 modulates astrocyte conversion into neuron in adult rat brain after stroke by targeting Pax6

Affiliations

MicroRNA-365 modulates astrocyte conversion into neuron in adult rat brain after stroke by targeting Pax6

Jia-Lin Mo et al. Glia. 2018 Jul.

Abstract

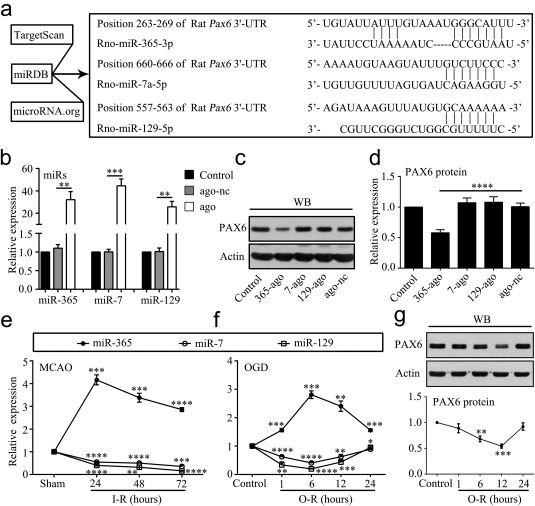
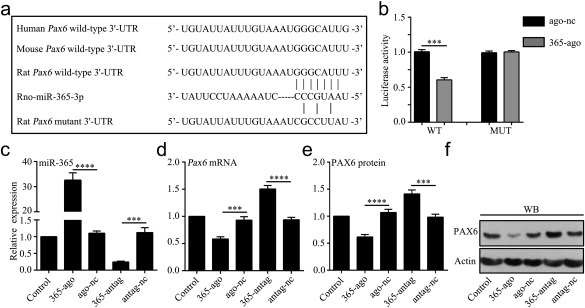
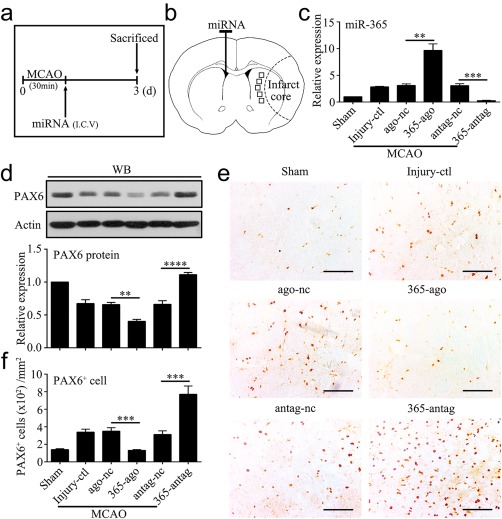
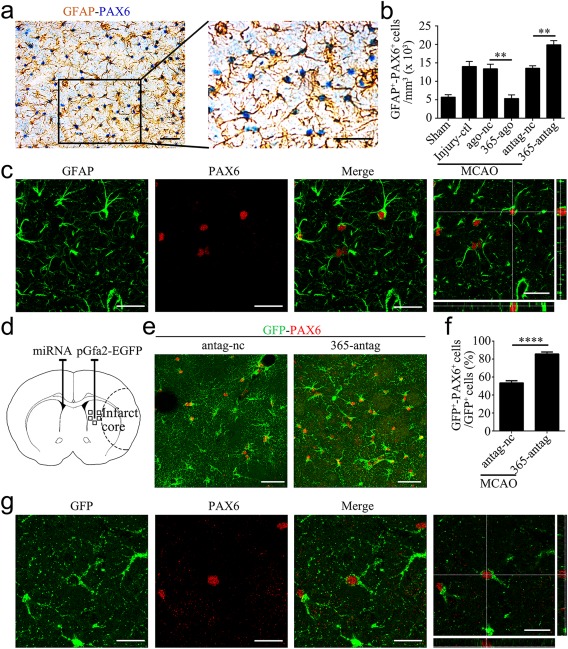
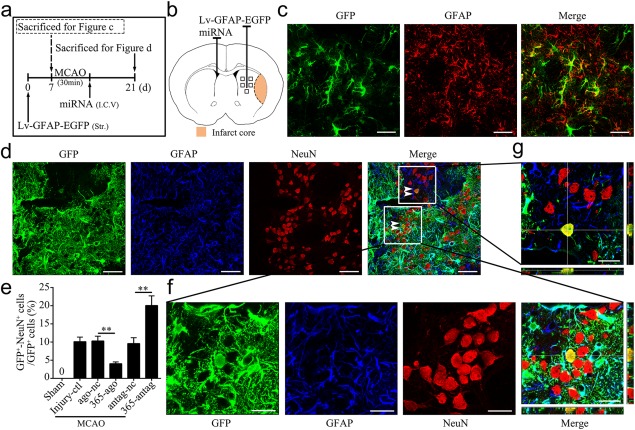
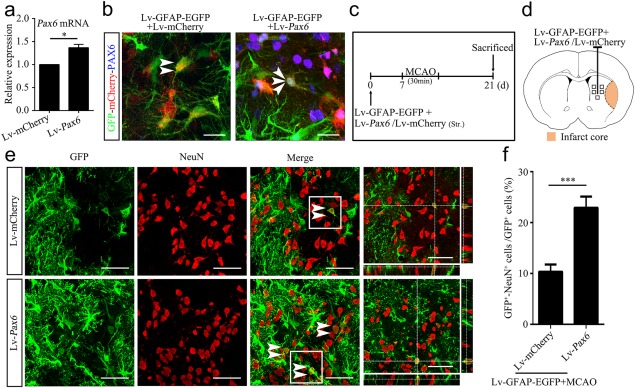
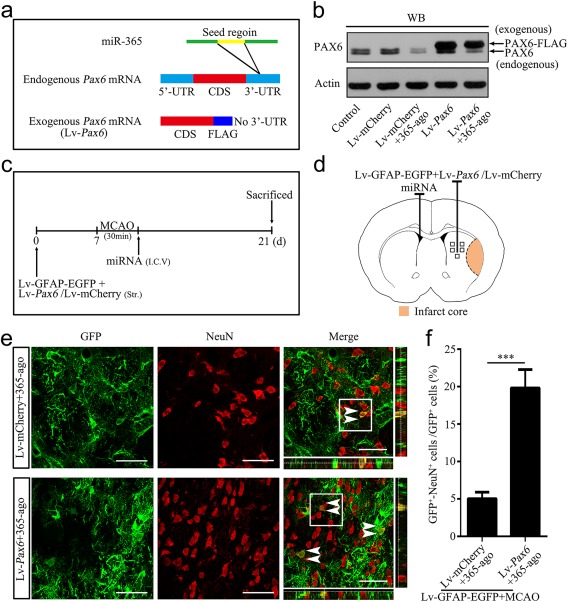
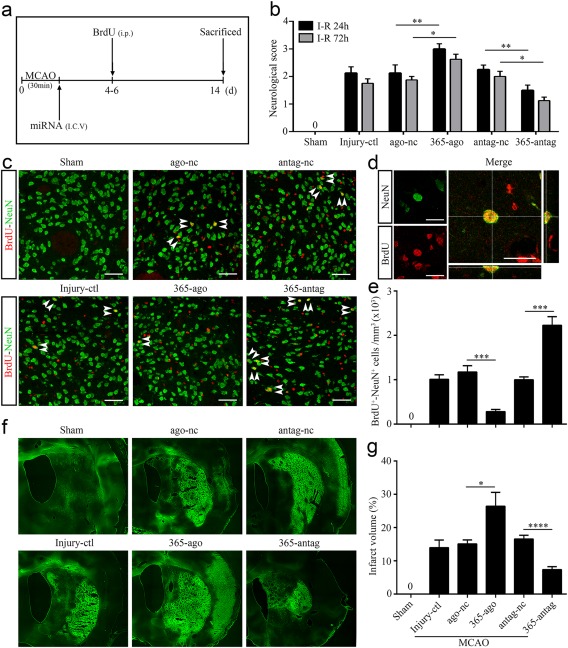
Reactive astrocytes induced by ischemia can transdifferentiate into mature neurons. This neurogenic potential of astrocytes may have therapeutic value for brain injury. Epigenetic modifications are widely known to involve in developmental and adult neurogenesis. PAX6, a neurogenic fate determinant, contributes to the astrocyte-to-neuron conversion. However, it is unclear whether microRNAs (miRs) modulate PAX6-mediated astrocyte-to-neuron conversion. In the present study we used bioinformatic approaches to predict miRs potentially targeting Pax6, and transient middle cerebral artery occlusion (MCAO) to model cerebral ischemic injury in adult rats. These rats were given striatal injection of glial fibrillary acidic protein targeted enhanced green fluorescence protein lentiviral vectors (Lv-GFAP-EGFP) to permit cell fate mapping for tracing astrocytes-derived neurons. We verified that miR-365 directly targets to the 3'-UTR of Pax6 by luciferase assay. We found that miR-365 expression was significantly increased in the ischemic brain. Intraventricular injection of miR-365 antagomir effectively increased astrocytic PAX6 expression and the number of new mature neurons derived from astrocytes in the ischemic striatum, and reduced neurological deficits as well as cerebral infarct volume. Conversely, miR-365 agomir reduced PAX6 expression and neurogenesis, and worsened brain injury. Moreover, exogenous overexpression of PAX6 enhanced the astrocyte-to-neuron conversion and abolished the effects of miR-365. Our results demonstrate that increase of miR-365 in the ischemic brain inhibits astrocyte-to-neuron conversion by targeting Pax6, whereas knockdown of miR-365 enhances PAX6-mediated neurogenesis from astrocytes and attenuates neuronal injury in the brain after ischemic stroke. Our findings provide a foundation for developing novel therapeutic strategies for brain injury.

Keywords: astrocyte; brain repair; glia; ischemic injury; microRNA; neurogenesis; neuron.


Figures

Figure 1
Figure 1
MiR‐365 is increased in the ischemic striatum and hypoxic cultured astrocytes. (a) Predicted miRs that have potential binding sites in the 3′‐UTR of Pax6 using bioinformatics analysis. (b) qRT‐PCR analysis of miR‐365, miR‐7 and miR‐129 expression in cultured astrocytes 48 hr after transfection of their corresponding miR agomirs (ago) or agomir negative control (ago‐nc). All miR expression levels were normalized to endogenous control U6 snRNA and relative to control (= 3). (c and d) Expression levels of PAX6 protein in cultured astrocytes 48 hr after transfection of miR‐365‐ago (365‐ago), miR‐7‐ago (7‐ago), miR‐129‐ago (129‐ago), or ago‐nc were analyzed by WB. All protein expression levels were normalized to endogenous control actin and relative to control (= 5). (e) qRT‐PCR analysis of miR‐365, miR‐7 and miR‐129 expression in the ipsilateral striatum at 24, 48, and 72 hr after ischemia‐reperfusion (I‐R) (= 3). (f) qRT‐PCR analysis of miR‐365, miR‐7 and miR‐129 expression in cultured astrocytes at 1, 6, 12, and 24 hr after OGD‐reperfusion (O‐R) (= 3). (g) Expression levels of PAX6 protein in cultured astrocytes at 1, 6, 12, and 24 hr after O‐R were analyzed by western blotting (WB) (= 3). In e, f, and g, the p values are for comparisons versus the sham and control group, respectively; *< .05, **< .01, ***< .001, and ****< .0001 by unpaired two‐tailed Student's t test. In b and d, **< .01, ***< .001, and ****< .0001 by one‐way ANOVA with Tukey's post‐hoc test. The data are presented as the means ± SEM
Figure 2
Figure 2
MiR‐365 directly targets PAX6 expression in cultured astrocytes. (a) Nucleotide sequence of the predicted miR‐365 binding site in the 3′‐UTR of Pax6. Shown are the seed sequence (CCCGUAA), wild‐type miR‐365 binding site (GGGCAUU) and the mutated miR‐365 binding site (CGCCUUA). (b) Luciferase assay in 293T cells 48 hr after transfection of luciferase reporter plasmid containing wild‐type (WT) or mutant (MUT) Pax6 3′‐UTR, together with 365‐ago or ago‐nc. Luciferase activity was calculated as renilla over firefly luciferase (= 3). (c) qRT‐PCR analysis of miR‐365 expression in cultured astrocytes 48 hr after transfection of 365‐ago, ago‐nc, miR‐365 antagomir (365‐antag) or antagomir negative control (antag‐nc) (= 3). (d–f) Expression levels of Pax6 mRNA and PAX6 protein in cultured astrocytes 48 hr after different treatments were analyzed by qRT‐PCR and WB, respectively. All mRNA expression levels were normalized to endogenous control actin mRNA (= 5). In b, ***< .001 by unpaired two‐tailed Student's t test; In c, d, and e, ***< .001 and ****< .0001 by one‐way ANOVA with Tukey's post‐hoc test. The data are presented as the means ± SEM
Figure 3
Figure 3
MiR‐365 antagomir increases PAX6 protein and PAX6‐positive cells in the ischemic striatum. (a) Illustration of animal experimental protocol. (b) Schematic of the brain showing the injection position of miRNA (contralateral ventricle) and the areas of immunoreactive cells counting (five fields of view). (c) qRT‐PCR analysis of miR‐365 expression in the ipsilateral striatum of rats 3 days after MCAO (= 3). Injury control rats (Injury‐ctl) indicated MCAO‐operated rats without other interventions. (d) Expression levels of PAX6 protein in the ipsilateral striatum of rats 3 days after MCAO were analyzed by Western blotting (WB) (= 5). (e) Representative images of immunolabeling of PAX6 in the brain sections of rats 3 days after MCAO. Scale bars: 100 μm. (f) The number of PAX6+ cell was counted as the average of the number of positive cells in the five fields of view (= 5). **< .01, ***< .001, and ****< .0001 by one‐way ANOVA with Tukey's post‐hoc test. The data are presented as the means ± SEM [Color figure can be viewed at http://wileyonlinelibrary.com]
Figure 4
Figure 4
MiR‐365 antagomir increases PAX6‐expressing astrocytes in the ischemic striatum. (a) Representative images of immunolabeling of GFAP and PAX6 in the brain sections of rats 3 days after MCAO. Scale bars: 50 μm. (b) The number of GFAP+/PAX6+ (GFAP+‐PAX6+) cells was counted as the average of the number of positive cells in the five fields of view (Figure 3b; = 3 in the sham group; = 5 in the other groups). (c) Confocal microphotograph showing co‐labeling of GFAP and PAX6. Scale bars: 20 μm. (d) Schematic of the brain showing the injection position of pGfa2‐EGFP plasmid (ipsilateral striatum) and miRNA (contralateral ventricle) and the areas of immunoreactive cells counting (five fields of view). (e) Representative images of immunofluorescent double labeling of GFP and PAX6 in the brain sections of rats 3 days after MCAO. Scale bars: 50 μm. (f) The number of GFP+/PAX6+ cell was counted as the percentage of the total number of GFP+ cells in the five fields of view (= 7 in the antag‐nc group; = 8 in the 365‐antag group). (g) Confocal microphotograph showing co‐labeling of GFP and PAX6. Scale bars: 20 μm. In f, ****< .0001 by unpaired two‐tailed Student's t test; In b, **< .01 by one‐way ANOVA with Tukey's post‐hoc test. The data are presented as the means ± SEM [Color figure can be viewed at http://wileyonlinelibrary.com]
Figure 5
Figure 5
MiR‐365 antagomir increases the conversion of astrocytes into mature neurons in the ischemic striatum. (a) Illustration of animal experimental protocol. (b) Schematic of the brain showing the injection position of Lv‐GFAP‐EGFP (ipsilateral striatum) and miRNA (contralateral ventricle) and the areas of immunoreactive cells counting (five fields of view). (c) Representative images of immunofluorescent double labeling of GFP and GFAP in the brain sections of rats 7 days after Lv‐GFAP‐EGFP injection. Scale bars: 50 μm. (d) Representative images of immunofluorescent triple labeling of GFP and GFAP and NeuN in the brain sections of rats 14 days after MCAO. The white double arrowheads indicate GFP+/NeuN+ cells. Scale bars: 50 μm. (e) The number of GFP+/NeuN+ cell was counted as the percentage of the total number of GFP+ cells in the five fields of view (= 3 in the sham group; = 6 in the other groups). (f and g) Confocal microphotograph showing co‐labeling of GFP and NeuN. Scale bars: 20 μm. **< .01 by one‐way ANOVA with Tukey's post‐hoc test. The data are presented as the means ± SEM [Color figure can be viewed at http://wileyonlinelibrary.com]
Figure 6
Figure 6
Overexpression of PAX6 increases the conversion of astrocytes into mature neurons in the ischemic striatum. (a) qRT‐PCR analysis of Pax6 mRNA expression in the normal striatum of rats 7 days after Lv‐Pax6 or Lv‐mCherry injection (= 3). (b) Representative images of immunofluorescent triple labeling of GFP and mCherry and PAX6 in the brain sections of rats 7 days after mixture lentivirus injection. The white double arrowheads indicate GFP+/mCherry+ cells, while the white triple arrowheads indicate GFP+/mCherry+/PAX6+ cells. Scale bars: 20 μm. (c) Illustration of animal experimental protocol. (d) Schematic of the brain showing the injection position of the mixture of Lv‐GFAP‐EGFP and Lv‐Pax6 or Lv‐mCherry (ipsilateral striatum) and the areas of immunoreactive cells counting (five fields of view). (e) Representative images of immunofluorescent double labeling of GFP and NeuN in the brain sections of rats 14 days after MCAO. The white double arrowheads indicate GFP+/NeuN+ cells. Scale bars: 50 μm. (f) The number of GFP+/NeuN+ cell was counted as the percentage of the total number of GFP+ cells in the five fields of view (= 6). *< .05 and ***< .001 by unpaired two‐tailed Student's t test. The data are presented as the means ± SEM [Color figure can be viewed at http://wileyonlinelibrary.com]
Figure 7
Figure 7
Overexpression of PAX6 abolishes the miR‐365‐mediated inhibition of astrocyte‐to‐neuron conversion in the ischemic striatum. (a) Illustration of the construction of the endogenous Pax6 mRNA and the exogenous Pax6 mRNA (Lv‐Pax6). (b) Expression levels of PAX6 protein in cultured astrocytes 7 days after Lv‐Pax6 or Lv‐mCherry transfection, in combination with 365‐ago treatment, were analyzed by WB. (c) Illustration of animal experimental protocol. (d) Schematic of the brain showing the injection position of the mixture of Lv‐GFAP‐EGFP and Lv‐Pax6 or Lv‐mCherry (ipsilateral striatum) and miRNA (contralateral ventricle) and the areas of immunoreactive cells counting (five fields of view). (e) Representative images of immunofluorescent double labeling of GFP and NeuN in the brain sections of rats 14 days after MCAO. The white double arrowheads indicate GFP+/NeuN+ cells. Scale bars: 50 μm. (f) The number of GFP+/NeuN+ cell was counted as the percentage of the total number of GFP+ cells in the five fields of view (= 6). ***< .001 by unpaired two‐tailed Student's t test. The data are presented as the means ± SEM [Color figure can be viewed at http://wileyonlinelibrary.com]
Figure 8
Figure 8
MiR‐365 antagomir promotes striatal neurogenesis and reduces brain damage after ischemic stroke. (a) Illustration of animal experimental protocol. (b) Neurological performance was assessed and scored according to Longa's method 1 and 3 days after MCAO (= 3 in the sham group; = 8 in the other groups). (c) Representative images of immunofluorescent double labeling of BrdU and NeuN in the brain sections of rats 14 days after MCAO. Scale bars: 50 μm. (d) Confocal microphotograph showing co‐labeling of BrdU and NeuN. Scale bars: 20 μm. (e) The number of NeuN+/BrdU+ cell was counted as the average of the number of positive cells in the five fields of view (Figure 3b; = 3 in the sham group; = 5 in the other groups). (f) Representative images of Fluoro‐Jade B staining in the brain sections of rats 14 days after MCAO. The bright green areas indicated infarct areas. (g) Infarct volume was calculated as a percentage of contralateral hemisphere volume (= 3 in the sham group; = 6 in the injury‐ctl, ago‐nc and 365‐ago groups; = 10 in the antag‐nc and 365‐antag groups). *< .05, **< .01, ***< .001, and ****< .0001 by one‐way ANOVA with Tukey's post‐hoc test. The data are presented as the means ± SEM [Color figure can be viewed at http://wileyonlinelibrary.com]

Similar articles

Cited by

References

    1. Allen, N. J. , & Barres, B. A. (2009). NEUROSCIENCE Glia – More than just brain glue. Nature, 457(7230), 675–677. https://doi.org/10.1038/457675a - DOI - PubMed
    1. Alvarez, J. I. , Katayama, T. , & Prat, A. (2013). Glial influence on the blood brain barrier. Glia, 61(12), 1939–1958. https://doi.org/10.1002/glia.22575 - DOI - PMC - PubMed
    1. Arvidsson, A. , Collin, T. , Kirik, D. , Kokaia, Z. , & Lindvall, O. (2002). Neuronal replacement from endogenous precursors in the adult brain after stroke. Nature Medicine, 8(9), 963–970. https://doi.org/10.1038/nm747 - DOI - PubMed
    1. Bartel, D. P. (2007). MicroRNAs: Genomics, biogenesis, mechanism, and function (Reprinted from Cell, vol 116, pg 281–297, 2004). Cell, 131(4), 11–29. https://doi.org/10.1016/S0092-8674(04)00045-5 - DOI - PubMed
    1. Bhalala, O. G. , Srikanth, M. , & Kessler, J. A. (2013). The emerging roles of microRNAs in CNS injuries. Nature Reviews Neurology, 9(6), 328–339. https://doi.org/10.1038/nrneurol.2013.67 - DOI - PMC - PubMed

Publication types

MeSH terms