

High spatiotemporal resolution bSSFP imaging of hyperpolarized [1-13 C]pyruvate and [1-13 C]lactate with spectral suppression of alanine and pyruvate-hydrate
- PMID: 29451329
- PMCID: PMC5980670
- DOI: 10.1002/mrm.27104
High spatiotemporal resolution bSSFP imaging of hyperpolarized [1-13 C]pyruvate and [1-13 C]lactate with spectral suppression of alanine and pyruvate-hydrate
Abstract
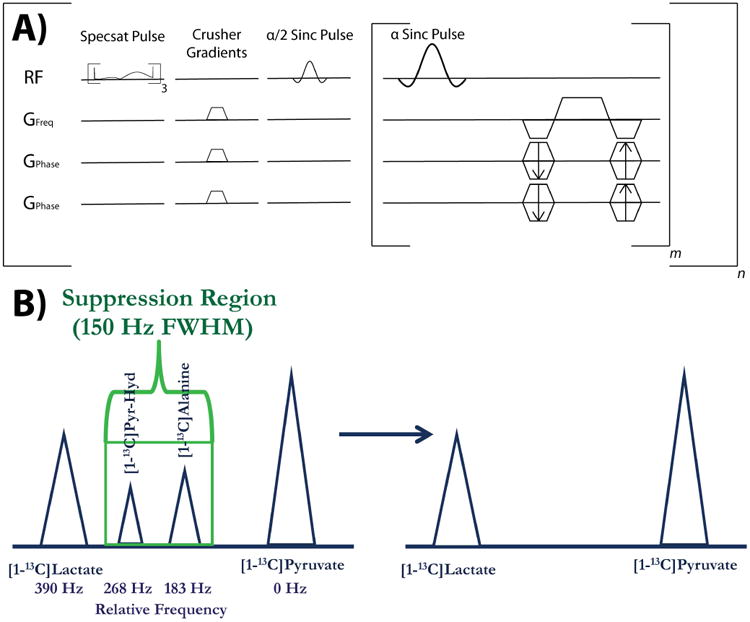
Purpose: The bSSFP acquisition enables high spatiotemporal resolution for hyperpolarized 13C MRI at 3T, but is limited by spectral contamination from adjacent resonances. The purpose of this study was to develop a framework for in vivo dynamic high resolution imaging of hyperpolarized [1-13C]pyruvate and [1-13C]lactate generated in vivo at 3T by simplifying the spectrum through the use of selective suppression pulses.
Methods: Spectral suppression pulses were incorporated into the bSSFP sequence for suppression of [1-13C]alanine and [1-13C]pyruvate-hydrate signals, leaving only the pyruvate and lactate resonances. Subsequently, the bSSFP pulse width, time-bandwidth, and repetition time were optimized for imaging these dual resonances.
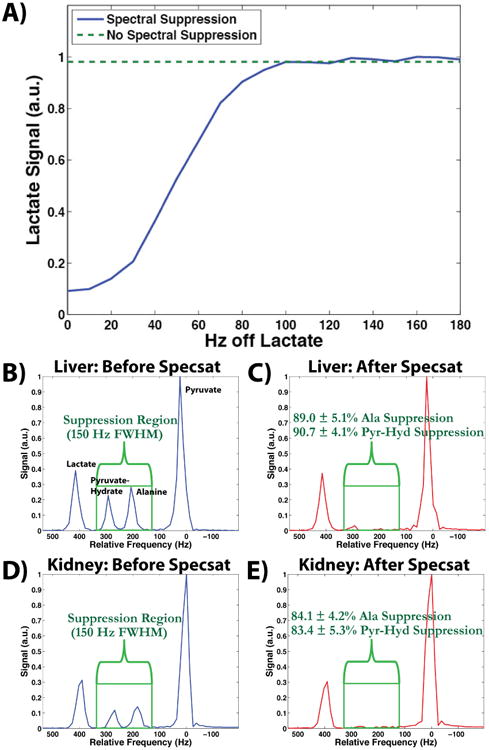
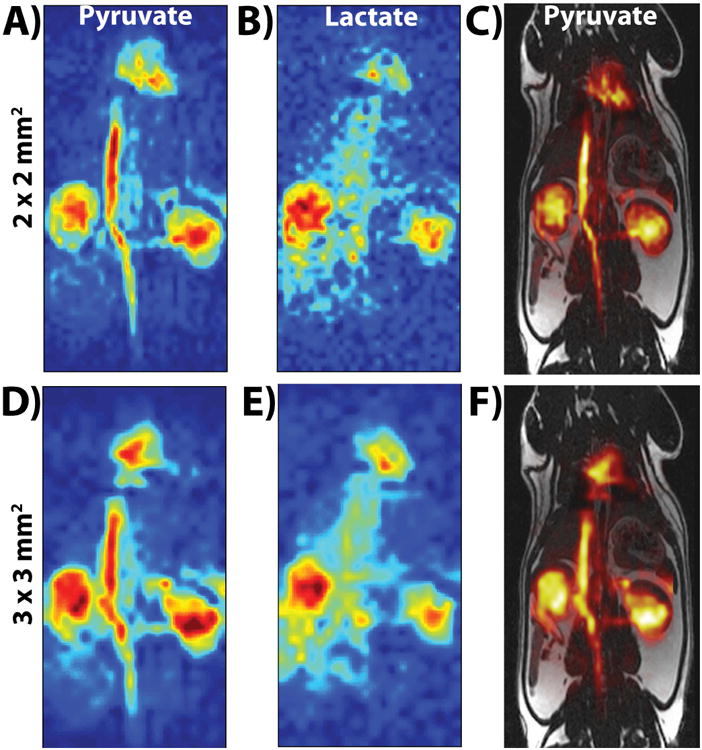
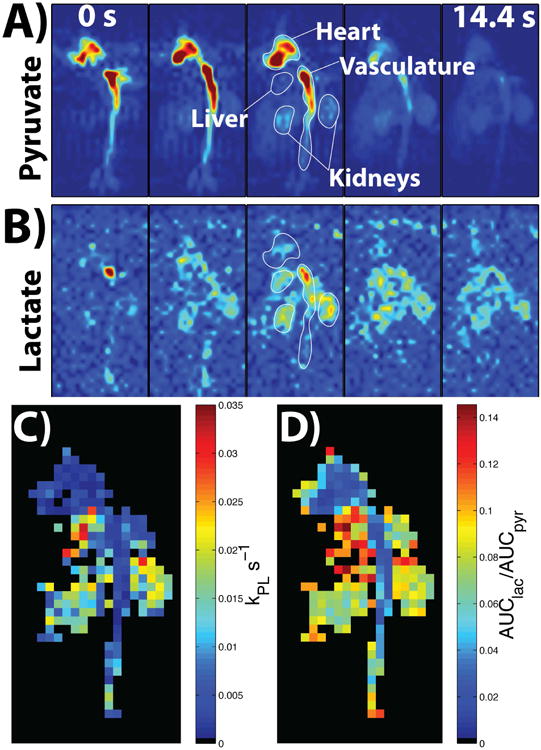
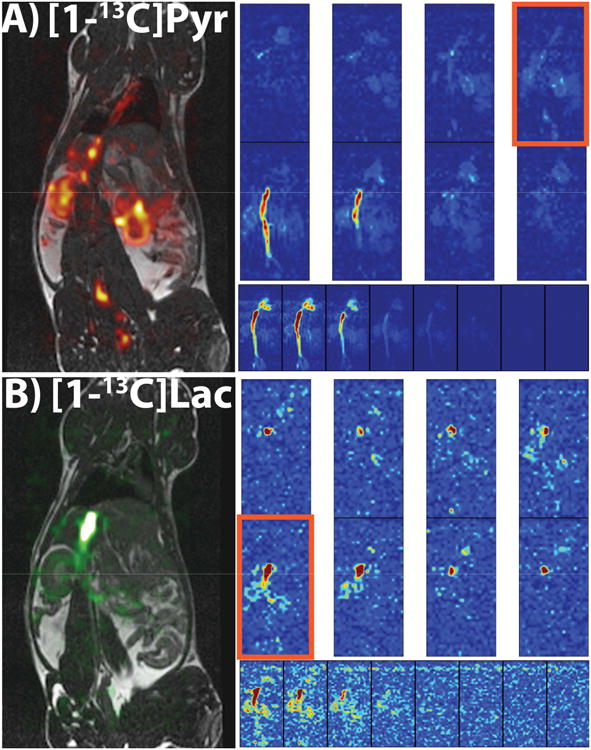
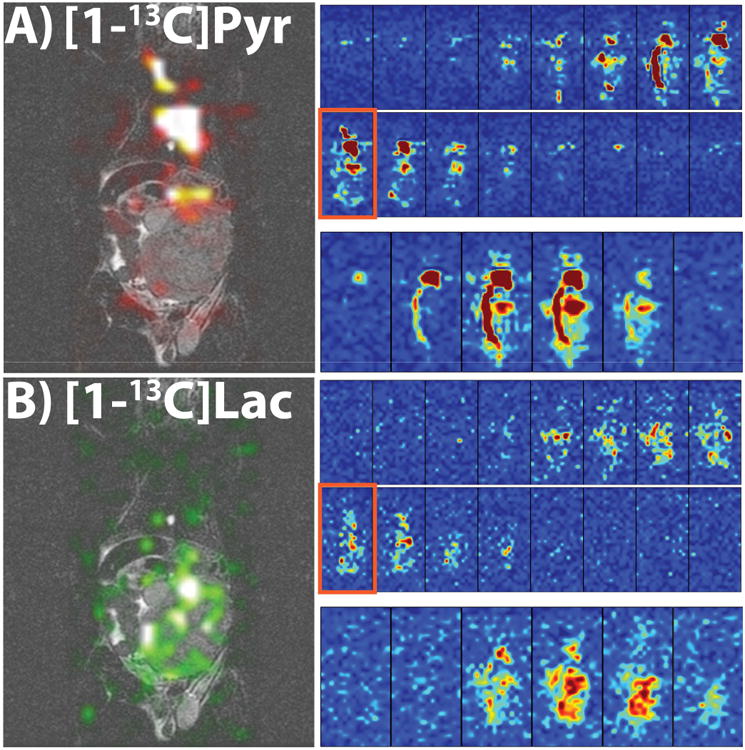
Results: The spectral suppression reduced both the alanine and pyruvate-hydrate signals by 85.5 ± 4.9% and had no significant effect on quantitation of pyruvate to lactate conversion (liver: P = 0.400, kidney: P = 0.499). High resolution (2 × 2 mm2 and 3 × 3 mm2) sub-second 2D coronal projections and 3D 2.5 mm isotropic images were obtained in rats and tumor-bearing mice with 1.8-5 s temporal resolution, allowing for calculation of lactate-to-pyruvate ratios and kPL.
Conclusion: The developed framework presented here shows the capability for dynamic high resolution volumetric hyperpolarized bSSFP imaging of pyruvate-to-lactate conversion on a clinical 3T MR scanner.
Keywords: 13C; SSFP; hyperpolarized; metabolism; pyruvate.
Figures
Similar articles
-
Spectrally selective bSSFP using off-resonant RF excitations permits high spatiotemporal resolution 3D metabolic imaging of hyperpolarized [1-13 C]Pyruvate-to-[1-13 C]lactate conversion.Magn Reson Med. 2023 Sep;90(3):894-909. doi: 10.1002/mrm.29676. Epub 2023 Apr 24. Magn Reson Med. 2023. PMID: 37093981
-
Selective spectroscopic imaging of hyperpolarized pyruvate and its metabolites using a single-echo variable phase advance method in balanced SSFP.Magn Reson Med. 2016 Oct;76(4):1102-15. doi: 10.1002/mrm.26004. Epub 2015 Oct 28. Magn Reson Med. 2016. PMID: 26507361 Free PMC article.
-
In vivo measurement of normal rat intracellular pyruvate and lactate levels after injection of hyperpolarized [1-(13)C]alanine.Magn Reson Imaging. 2011 Oct;29(8):1035-40. doi: 10.1016/j.mri.2011.07.001. Epub 2011 Aug 19. Magn Reson Imaging. 2011. PMID: 21855243 Free PMC article.
-
In vivo imaging of the progression of acute lung injury using hyperpolarized [1-13 C] pyruvate.Magn Reson Med. 2017 Dec;78(6):2106-2115. doi: 10.1002/mrm.26604. Epub 2017 Jan 11. Magn Reson Med. 2017. PMID: 28074497 Free PMC article.
-
Hyperpolarized agents for advanced MRI investigations.Q J Nucl Med Mol Imaging. 2009 Dec;53(6):604-17. Q J Nucl Med Mol Imaging. 2009. PMID: 20016452 Review.
Cited by
-
Pulse sequence considerations for quantification of pyruvate-to-lactate conversion kPL in hyperpolarized 13 C imaging.NMR Biomed. 2019 Mar;32(3):e4052. doi: 10.1002/nbm.4052. Epub 2019 Jan 21. NMR Biomed. 2019. PMID: 30664305 Free PMC article.
-
High Intrarenal Lactate Production Inhibits the Renal Pseudohypoxic Response to Acutely Induced Hypoxia in Diabetes.Tomography. 2019 Jun;5(2):239-247. doi: 10.18383/j.tom.2019.00003. Tomography. 2019. PMID: 31245545 Free PMC article.
-
Metabolite-Specific Echo Planar Imaging for Preclinical Studies with Hyperpolarized 13C-Pyruvate MRI.Tomography. 2023 Mar 27;9(2):736-749. doi: 10.3390/tomography9020059. Tomography. 2023. PMID: 37104130 Free PMC article.
-
Hyperpolarized 13 C MRI data acquisition and analysis in prostate and brain at University of California, San Francisco.NMR Biomed. 2021 May;34(5):e4280. doi: 10.1002/nbm.4280. Epub 2020 Mar 19. NMR Biomed. 2021. PMID: 32189442 Free PMC article.
-
Inductively coupled, transmit-receive coils for proton MRI and X-nucleus MRI/MRS in small animals.J Magn Reson Open. 2023 Dec;16-17:100123. doi: 10.1016/j.jmro.2023.100123. Epub 2023 May 20. J Magn Reson Open. 2023. PMID: 38046795 Free PMC article.
References
Publication types
MeSH terms
Substances
Grants and funding
LinkOut - more resources
Full Text Sources
Other Literature Sources
Medical
