. 2018 Jul;36(7):1109-1121.
doi: 10.1002/stem.2808. Epub 2018 Mar 5.

Mesenchymal Stem Cells Protect Against Hypoxia-Ischemia Brain Damage by Enhancing Autophagy Through Brain Derived Neurotrophic Factor/Mammalin Target of Rapamycin Signaling Pathway

Affiliations

Mesenchymal Stem Cells Protect Against Hypoxia-Ischemia Brain Damage by Enhancing Autophagy Through Brain Derived Neurotrophic Factor/Mammalin Target of Rapamycin Signaling Pathway

Zhen Zheng et al. Stem Cells. 2018 Jul.

Abstract

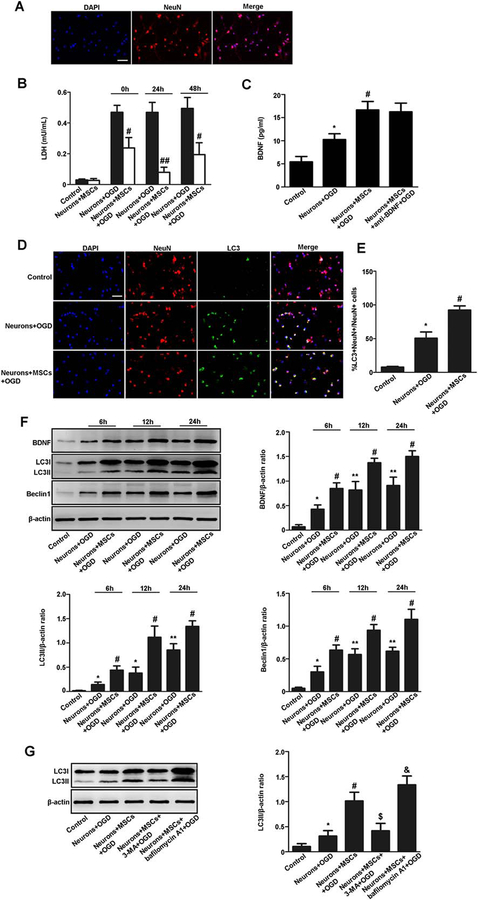
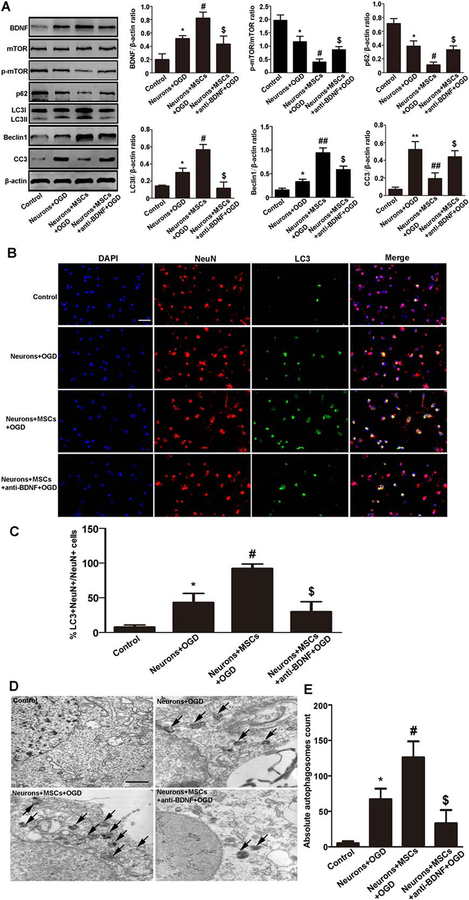
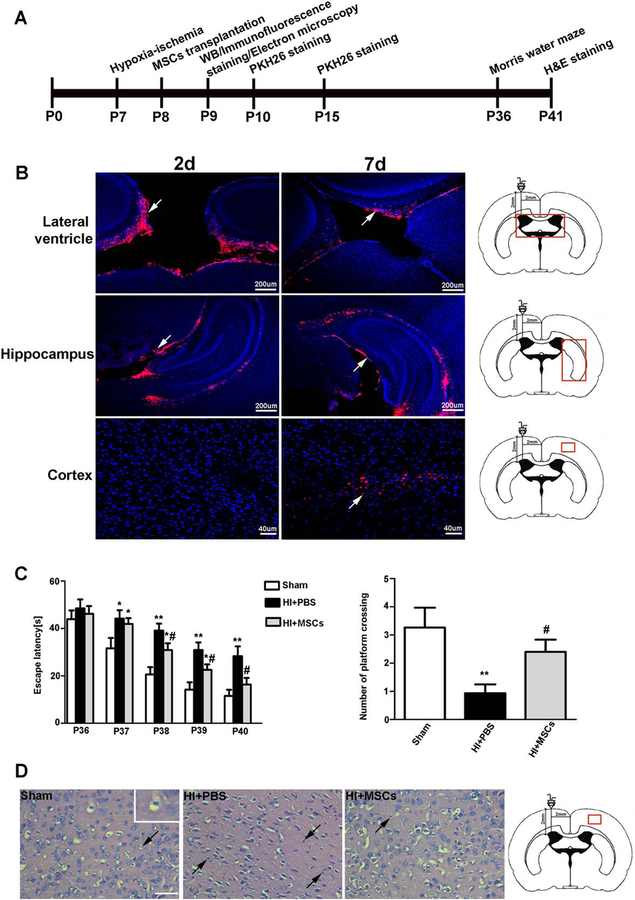
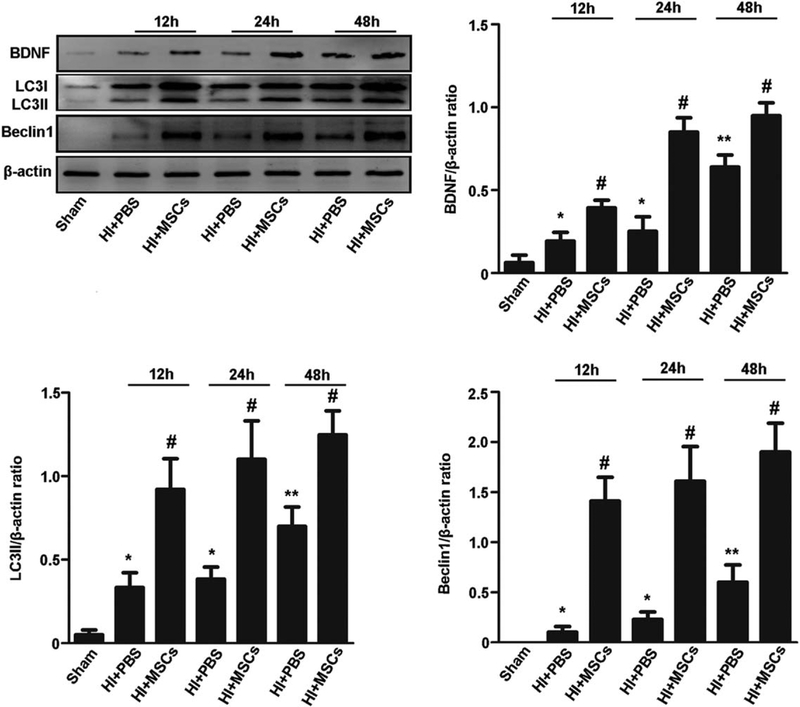
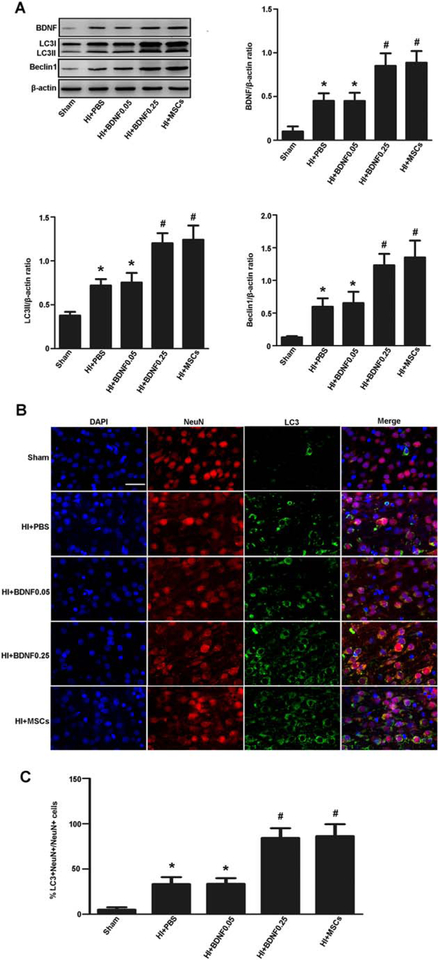
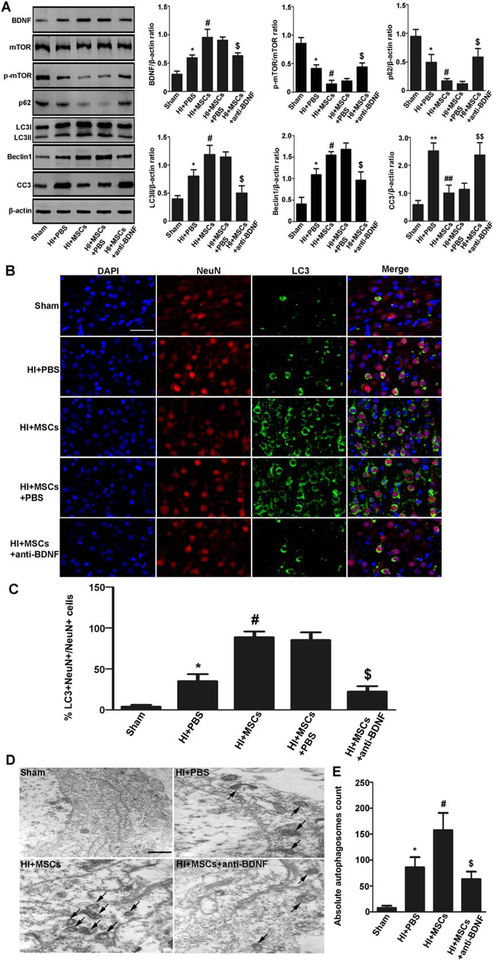
Hypoxic-ischemic encephalopathy (HIE) is a serious disease for neonates. However, present therapeutic strategies are not effective enough for treating HIE. Previous study showed that mesenchymal stem cells (MSCs) can exert neuroprotective effects for brain damage, but its mechanism remains elusive. Using in vitro coculture of rat cortical primary neurons and MSCs in HI conditions, we demonstrated that MSCs help increase brain derived neurotrophic factor (BDNF) and autophagy markers (LC3II and Beclin1) in the cultures and decrease cells death (lactate dehydrogenase levels). We demonstrated a similar mechanism using an in vivo rat model of HI in combination with MSCs transplantation. Using a behavioral study, we further showed that MSCs transplantation into the rat brain after HI injury can attenuate behavioral deficits. Finally, we found that the increase in BDNF and autophagy related factors after HI injury combined with MSCs transplantation can be reversed by anti-BDNF treatment and strengthen the point that the protective effects of BDNF work through inhibition of the mammalin target of rapamycin (mTOR) pathway. Collectively, we proposed that coculture/transplantation of MSCs after HI injury leads to increased BDNF expression and a subsequent reduction in mTOR pathway activation that results in increased autophagy and neuroprotection. This finding gives a hint to explore new strategies for treating neonates with HIE. Stem Cells 2018;36:1109-1121.

Keywords: Autophagy; Brain damage; Brain derived neurotrophic factor; Hypoxia-ischemia; Mammalian target of rapamycin; Mesenchymal stem cells.


Conflict of interest statement

Disclosure of Potential Conflicts of Interest

The authors indicated no potential conflicts of interest.

Figures

Figure 1.
Figure 1.
MSCs have neuroprotective effects on neurons following OGD treatment by enhancing autophagy. (A): Immunofluorescent staining of NeuN (red) and quantitative analyses of NeuN positive cells. The NeuN-positive neurons were above 95% in the culture. (B): LDH was detected in the neuronal medium following OGD treatment. LDH was significantly reduced in the neuronal medium cocultured with MSCs (0, 24, 48 hours prior to OGD treatment) compared with the non-coculture group. (C): The BDNF level in the neuronal medium was detected by enzyme-linked immunosorbent assay 24 hours after OGD treatment. Neurons cultured on day in vitro 7 without OGD treatment nor cocultured with MSCs were used as control group. The anti-BDNF antibody group is a group that anti-BDNF neutralizing antibody was added to the medium of the MSCs coculture 24 hours before OGD. The BDNF level was higher in the medium of the OGD group than that in the control group. The BDNF level was also higher in the medium of the MSCs coculture group than that in the non-coculture group after OGD treatment. The BDNF level was not different between the MSCs coculture group and the anti-BDNF antibody group. (D, E): Immunofluorescent staining and quantitative analyses of NeuN (red) and LC3 (green) and quantitative analyses of LC3 positive neurons. LC3-positive neurons were increased in the MSCs coculture group compared with the non-coculture group at 24 hours after OGD treatment. Scale bar = 40 μm. (F): Representative Western blot and quantitative analyses of BDNF, LC3II, and Beclin1. Results are presented as the ratio of BDNF, LC3II, and Beclin1 normalized to β-actin. The expression of BDNF, LC3II, and Beclin1 was higher in the MSCs coculture group than that in the non-coculture group at 6, 12, and 24 hours after OGD treatment, especially at 24 hours after OGD treatment. (G): Representative Western blot and quantitative analyses of LC3II in neurons. Results are presented as the ratio of LC3II normalized to β-actin. The expression of LC3II was higher at 24 hours after OGD treatment when compared the OGD group with the control group, the MSCs coculture group with the non-coculture group, and 3-MA treatment further decreased LC3II level while bafilomycin A1 treatment increased LC3II level. Values are expressed as mean ± SEM, n = 8. *, p<.05, **, p<.01 for the non-coculture group versus the control group; #, p<.05, ##, p<.01 for the MSCs coculture group versus the non-coculture group; $, p<.05 for the MSCs coculture group with 3-MA treatment versus the MSCs coculture group; &, p<.05 for the MSCs coculture group with bafilomycin A1 treatment versus the MSCs coculture group. Abbreviations: BDNF, brain derived neurotrophic factor; DAPI, 4′,6-diamidino-2-phenylindole; LDH, lactate dehydrogenase; MSCs, mesenchymal stem cells; OGD, oxygen glucose deprivation.
Figure 2.
Figure 2.
MSCs enhanced neuronal autophagy by secreting BDNF following OGD treatment. (A): Representative Western blot and quantitative analyses of BDNF, mTOR, p-mTOR, p62, LC3II, Beclin1, and CC3 in neurons. Neurons cultured on day 7 without OGD treatment nor cocultured with MSCs were used as control group. The expression of BDNF, LC3II, and Beclin1 was higher in the OGD group than that in the control group at 24 hours after OGD treatment. The expression of BDNF, LC3II, and Beclin1 was higher whereas p-mTOR/mTOR, p62, CC3 was lower in the MSCs coculture group than that in the non-coculture group or the anti-BDNF antibody group. (B, C): Immunofluorescent staining and quantitative analyses of NeuN (red) and LC3 (green). Neurons cultured on day 7 without OGD treatment nor cocultured with MSCs were used as control group. LC3-positive neurons were increased in the OGD group compared with the control group at 24 hours after OGD treatment. LC3-positive neurons were also increased in the MSCs coculture group compared with the non-coculture group or the anti-BDNF antibody group. Scale bar = 40 μm. (D, E): Neuronal autophagy observed by electron microscopy was quantified by counting total number of autophagosomes. Data represent 6 rats per culture and 20 fields/section. It showed that autophagosomes were increased in the OGD group compared with the control group at 24 hours after OGD treatment. Autophagosomes were also increased in the MSCs coculture group compared with the OGD group or the anti-BDNF antibody group. Scale bar = 1 μm. Values are expressed as mean ± SEM, n = 6. *, p<.05, **, p<.01 for the non-coculture group versus the control group; #, p<.05, ##, p<.01 for the MSCs coculture group versus the non-coculture group; $, p<.05 for the anti-BDNF antibody group versus the MSCs coculture group. Abbreviations: BDNF, brain derived neurotrophic factor; DAPI, 4′,6-diamidino-2-phenylindole; MSCs, mesenchymal stem cells; mTOR, mammalin target of rapamycin; OGD, oxygen glucose deprivation; p-mTOR, phosphorylated-mTOR.
Figure 3.
Figure 3.
MSCs transplantation has neuroprotective effects on rats with HIBD. (A): Experimental procedural timeline was shown. Rats were subjected to HI insult at P7, and then they were received MSCs transplantation at P8. The rats were sacrificed, and their ipsilateral cortexes were collected for immunofluorescent staining, Western blot and electron microscopy at P9. PKH26 staining was done at P10 and P15. The morris water maze was examined at P36. H&E staining was performed at P41. (B): Immunofluorescent staining showed that the PKH-26-labeled MSCs were in the lateral ventricle and migrated out of the ventricle to the hippocampus 2 days after MSCs transplantation. The PKH-26-labeled MSCs were observed in the cortex 7 days after MSCs transplantation. (C): The morris water maze was tested in the rats. The sham rats were only subjected to isolation and stringing of the vessels without occlusion and ischemia. The sham group showed a significantly faster latency of swimming over the platform location than the HIBD group or the MSC-transplanted group from postnatal day 37 to postnatal day 39. The MSC-transplanted group showed a significantly faster latency of swimming over the platform location than the HIBD group from postnatal day 38 to postnatal day 40. Furthermore, the HIBD group showed fewer platform crossings than the sham group or MSC-transplanted group, while there was no difference between the sham group and the MSC-transplanted group. (D): H&E staining in the rats. H&E staining showed that neurons in the cortex were arranged orderly with complete cell structures in the sham group. The neurons arrangement was disordered, and a large number of neurons appeared shrunken with nuclear pyknosis in the HIBD group. MSCs transplantation markedly ameliorated these pathological changes. Scale bar = 50 μm. Values are expressed as mean ± SEM, n = 15 for morris water maze, n = 8 for H&E staining. *, p<.05, **, p<.01 for the MSC-transplanted group or the HIBD group versus the sham group; #, p<.05 for the MSC-transplanted group versus the HIBD group. Abbreviations: HIBD, hypoxia-ischemia brain damage; MSCs, mesenchymal stem cells; PBS, phosphate-buffered saline.
Figure 4.
Figure 4.
MSCs enhanced neuronal autophagy in rats with hypoxia-ischemia brain damage (HIBD). Representative Western blot and quantitative analyses of BDNF, LC3II, and Beclin1. Results are presented as the ratio of BDNF, LC3II, and Beclin1 normalized to β-actin. The expression of BDNF, LC3II, and Beclin1 protein was significantly higher in the cortex of HIBD group than that in the sham group at 12, 24, 48 hours after MSCs transplantation. The expression of BDNF, LC3II, and Beclin1 protein was significantly higher in the cortex of MSC-transplanted group than that in the HIBD group at 12, 24, 48 hours after MSCs transplantation. Values are expressed as mean ± SEM, n = 6. *, p<.05, **, p<.01 for the HIBD group versus the sham group; #, p<.05 for the MSC-transplanted group versus the HIBD group. Abbreviations: BDNF, brain derived neurotrophic factor; MSCs, mesenchymal stem cells; PBS, phosphate-buffered saline.
Figure 5.
Figure 5.
BDNF enhanced autophagy in rats with hypoxia-ischemia brain damage (HIBD). (A): Representative Western blot and quantitative analyses of BDNF, LC3II, and Beclin1. The expression of BDNF, LC3II, and Beclin1 protein was significantly higher in the cortex when compared the HIBD group with the sham group, BDNF-treated (0.25 μg BDNF) group with the HIBD group, and the MSC-transplanted group with the HIBD group. (B, C): Immunofluorescent staining and quantitative analyses of NeuN (red) and LC3 (green). LC3-positive neurons were increased in the cortex when compared the HIBD group with the sham group, the BDNF-treated (0.25 μg BDNF) group with the HIBD group, and the MSC-transplanted group with the HIBD group. Scale bar = 50 μm. Values are expressed as mean ± SEM, n = 6. *, p<.05 for HIBD group or BDNF-treated group (0.05 μg) versus the sham group; #, p<.05 for BDNF-treated group (0.25 μg) or the MSC-transplanted group versus the HIBD group. Abbreviations: BDNF, brain derived neurotrophic factor; DAPI, 4′,6-diamidino-2-phenylindole; MSC, mesenchymal stem cell; PBS, phosphate-buffered saline.
Figure 6.
Figure 6.
MSCs enhanced autophagy by increasing BDNF in rats with hypoxia-ischemia brain damage (HIBD). (A): Representative Western blot and quantitative analyses of BDNF, mTOR, p-mTOR, p62, LC3II, Beclin1, and CC3. The expression of BDNF, LC3II, and Beclin1 was significantly higher whereas p-mTOR/mTOR, p62, and CC3 was lower in the cortex when compared the HIBD group with the sham group, the MSC-transplanted group with the HIBD group, the MSCs plus PBS pretreatment group with the MSCs plus anti-BDNF antibody pretreatment group. (B, C): Immunofluorescence staining and quantitative analyses of for NeuN (red) and LC3 (green). LC3-positive neurons were increased in the cortex when compared the HIBD group with the sham group, the MSC-transplanted group with the HIBD group, the MSCs plus PBS pretreatment group with the MSCs plus anti-BDNF antibody pretreatment group. Scale bar = 50 μm. (D, E): Neuronal autophagy observed by electron microscopy was quantified by counting total number of autophagosomes. Data represent 4 rats per group, 3 section per rats; 20 fields/section. It showed that autophagosomes were increased in the cortex when compared the HIBD group with the sham group, the MSC-transplanted group with the HIBD group, the MSC-transplanted group with the MSCs plus anti-BDNF antibody pretreatment group. Scale bar = 1 μm. Values are expressed as mean ± SEM, n = 6. *, p<.05 for HIBD group versus the sham group; #, p<.05 for the MSC-transplanted group versus the HIBD group; $, p<.05 the MSCs with PBS pretreatment group versus the MSCs with anti-BDNF antibody pretreatment group. Abbreviations: BDNF, brain derived neurotrophic factor; DAPI, 4′,6-diamidino-2-phenylindole; MSCs, mesenchymal stem cells; mTOR, mammalin target of rapamycin; p-mTOR, phosphorylated-mTOR; PBS, phosphate-buffered saline.

Similar articles

Cited by

References

    1. Vannucci SJ, Hagberg H. Hypoxia-ischemia in the immature brain. J Exp Biol 2004; 207:3149–3154. - PubMed
    1. Douglas-Escobar M, Weiss MD. Hypoxic-ischemic encephalopathy: A review for the clinician. JAMA Pediatr 2015;169:397–403. - PubMed
    1. Cuervo AM. Chaperone-mediated autophagy: Selectivity pays off. Trends Endocrinol Metab 2010;21:142–150. - PMC - PubMed
    1. Mizushima N, Levine B, Cuervo AM et al. Autophagy fights disease through cellular self-digestion. Nature 2008;451:1069–1075. - PMC - PubMed
    1. Carloni S, Albertini MC, Galluzzi L et al. Increased autophagy reduces endoplasmic reticulum stress after neonatal hypoxia-ischemia: Role of protein synthesis and autophagic pathways. Exp Neurol 2014;255:103–112. - PubMed

Publication types

Substances