. 2018 Feb 16;14(2):e1006000.
doi: 10.1371/journal.pcbi.1006000. eCollection 2018 Feb.

A stochastic and dynamical view of pluripotency in mouse embryonic stem cells

Affiliations

A stochastic and dynamical view of pluripotency in mouse embryonic stem cells

Yen Ting Lin et al. PLoS Comput Biol. .

Abstract

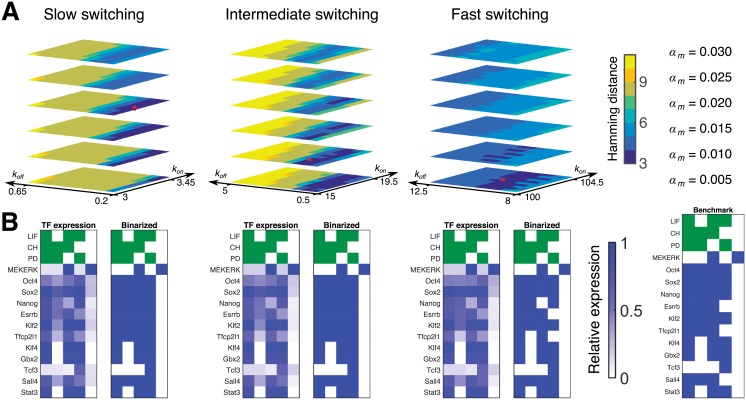
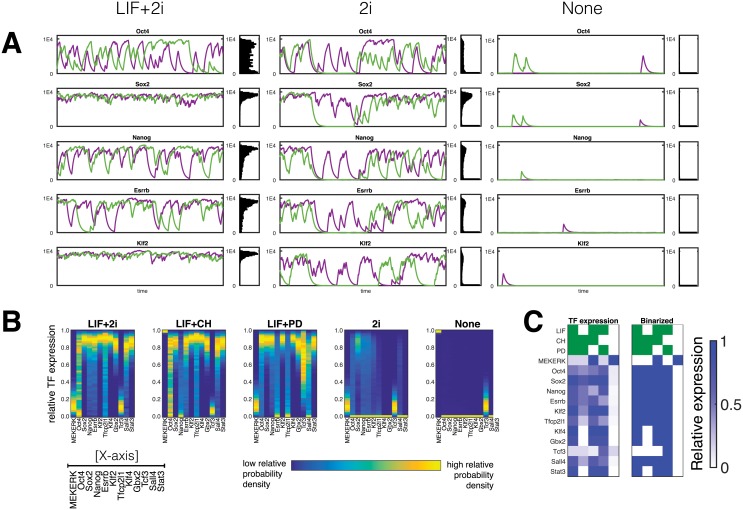
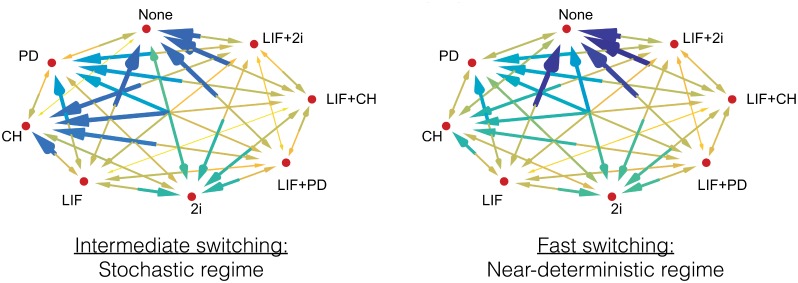
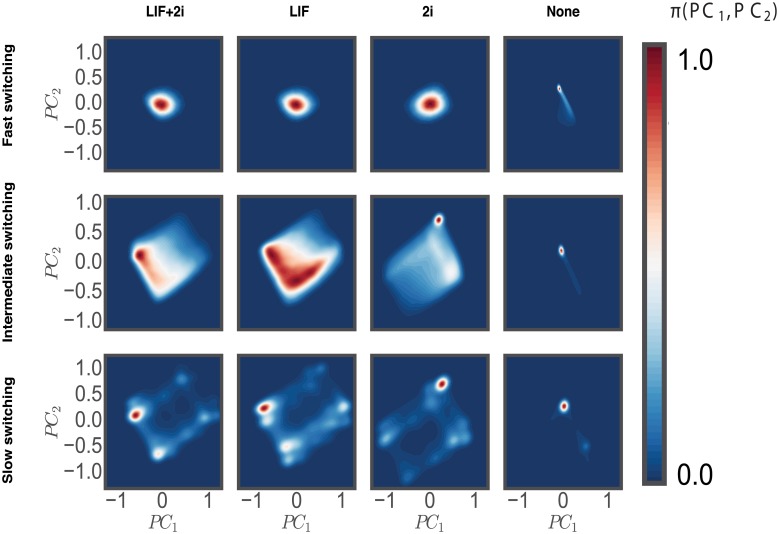
Pluripotent embryonic stem cells are of paramount importance for biomedical sciences because of their innate ability for self-renewal and differentiation into all major cell lines. The fateful decision to exit or remain in the pluripotent state is regulated by complex genetic regulatory networks. The rapid growth of single-cell sequencing data has greatly stimulated applications of statistical and machine learning methods for inferring topologies of pluripotency regulating genetic networks. The inferred network topologies, however, often only encode Boolean information while remaining silent about the roles of dynamics and molecular stochasticity inherent in gene expression. Herein we develop a framework for systematically extending Boolean-level network topologies into higher resolution models of networks which explicitly account for the promoter architectures and gene state switching dynamics. We show the framework to be useful for disentangling the various contributions that gene switching, external signaling, and network topology make to the global heterogeneity and dynamics of transcription factor populations. We find the pluripotent state of the network to be a steady state which is robust to global variations of gene switching rates which we argue are a good proxy for epigenetic states of individual promoters. The temporal dynamics of exiting the pluripotent state, on the other hand, is significantly influenced by the rates of genetic switching which makes cells more responsive to changes in extracellular signals.


Conflict of interest statement

The authors have declared that no competing interests exist

Figures

Fig 1
Fig 1. Network topology and molecular logic.
The left panel shows a schematic diagram of the network topology, reproduced from Dunn et al. [16]. Each node corresponds to a given gene and their placement from left to right is chosen to indicate a trend of downstreamness from three external inputs. In our mechanistic model, each gene produces a unique transcription factor at a rate which depending on the binding state of its promoter site. These transcription factors then go on to bind and activate (black arrow) or repress (red bar) other genes. The three nodes on left correspond to extra-cellular signals, which are either absent or present. The right panel shows our assumed molecular logic of transcriptional regulation when there are N = 2 promoter sites per gene. Each circle is a binding site: it can be either empty (white), bound by an activator (green), or bound by a repressor (red). The right panel lists possible combinations of the promoter sites. Depending on the configuration of the promoter site, transcription factors are produced with rates 0, Ωαm, and Ωαmax, modeling the effects of cooperative binding.
Fig 2
Fig 2. PDMP stochastic simulations identify three genetic switching regimes that are consistent with experimental data.
When switching is slow, intermediate, or fast we find certain parameters which closely match the experimental results obtained by Dunn et al. [16]. The consistency of our model with experimental results is measured using a Hamming distance—a measure where one counts the number of discrepancies between the binary expression of each TF for both cases. (A) Shown are the identified regions in parameter regimes that minimize Hamming distance. There are three free parameters: the binding rate kon, unbinding rate koff, and basal transcription rate αm. For slow switching, the parameters are kon = 3.2, koff = 0.2, αm = 0.02; for intermediate switching, kon = 16, koff = 1.5, αm = 0.01; for fast switching, kon = 102, koff = 10, αm = 0.005. The selected parameter sets are presented as red dots in the landscapes in the upper panel, hereby referred to as the slow, fast and intermediate parameter regimes. (B) Comparison of computed and discretized gene expression profiles with those of the experiments (Benchmark panel) [16].
Fig 3
Fig 3. Gene expression profiles of pluripotency factors predicted by PDMP simulations.
Each column corresponds to different external inputs, and each row corresponds to regimes of slow, intermediate and fast gene switching. More than 105 sample paths were used for generating each condition.
Fig 4
Fig 4. Gene expression profiles of pluripotency factors predicted by individual-based simulations.
The intermediate switching regime is chosen to be presented as it is the regime which best captures the experimentally measured distributions [7, 8]. (A) Shown are two representative trajectories and full distributions of select few transcription factors under three different conditions generated by individual-based simulations. Typical lifetime for pluripotency transcription factors [–28] (∼ 1 hr) is used for setting the absolute time-scale of simulations (B) Gene expression profile showing the near quantitative agreement with results of PDMP simulations shown in Fig 3. (C) Gene expression profile of individual-based model, for comparison with the PDMP and experimental benchmark shown in Fig 2.
Fig 5
Fig 5. The dynamical behavior of the distributions of transcription factor densities for the intermediate and fast switching regimes.
At time t = 0, the external inputs are changed. The plots show the evolution in probability density for a large ensemble (105) of PDMP sample paths. The times and populations are respectively rescaled by 1/γ and αmax/γ (see Method section). We assume the proteins are stable and so the their estimated half-life is of an order 8 hour [7]; in other words γ ∼ 1/8 hr−1, and the entire course of simulation (t ∈ (0, 30)) corresponds to physically 240 hours. A validation of the PDMP prediction by individual-based simulations can be found in S8 Fig in the Supporting Information.
Fig 6
Fig 6. Transition times between the stationary distributions of different external conditions.
A larger, darker arrow indicates that a given transition takes a longer time to converge to its stationary state. This time scale is measured by simulating a large ensemble (105) of PDMP sample paths to provide a simulated probability density and finding the Jensen–Shannon divergence [69, 70] between the instantaneous distribution of each TF and its final stationary distribution. The time for the each divergence to fall below a threshold (≔ 0.3) is recorded, and we choose the largest of these as a quantification of the transition time. The numerical values can be found in S1 and S2 Tables in the Supporting Information.
Fig 7
Fig 7. Mapping the cellular attractors of the genetic network under different switching and signaling conditions.
We project PDMP-simulated gene expression distributions onto the first two principal components. The reference state for principal components was chosen to be the LIF+2i/intermediate switching.

Similar articles

Cited by

References

    1. Evans M. Discovering pluripotency: 30 years of mouse embryonic stem cells. Nat Rev Mol Cell Biol. 2011;12(10):680–686. doi: 10.1038/nrm3190 - DOI - PubMed
    1. Murry CE, Keller G. Differentiation of embryonic stem cells to clinically relevant populations: lessons from embryonic development. Cell. 2008;132(4):661–680. - PubMed
    1. Martello G, Smith A. The nature of embryonic stem cells. Ann Rev Cell Dev Biol. 2014;30(1):647 doi: 10.1146/annurev-cellbio-100913-013116 - DOI - PubMed
    1. Van Kampen NG. Stochastic processes in physics and chemistry. vol. 1 Elsevier; 1992.
    1. Symmons O, Raj A. What’s Luck Got to Do with It: Single Cells, Multiple Fates, and Biological Nondeterminism. Mol cell. 2016;62(5):788–802. doi: 10.1016/j.molcel.2016.05.023 - DOI - PMC - PubMed

Publication types

Substances

LinkOut - more resources