. 2018 Feb 16;16(2):e2003174.
doi: 10.1371/journal.pbio.2003174. eCollection 2018 Feb.

A damped oscillator imposes temporal order on posterior gap gene expression in Drosophila

Affiliations

A damped oscillator imposes temporal order on posterior gap gene expression in Drosophila

Berta Verd et al. PLoS Biol. .

Abstract

Insects determine their body segments in two different ways. Short-germband insects, such as the flour beetle Tribolium castaneum, use a molecular clock to establish segments sequentially. In contrast, long-germband insects, such as the vinegar fly Drosophila melanogaster, determine all segments simultaneously through a hierarchical cascade of gene regulation. Gap genes constitute the first layer of the Drosophila segmentation gene hierarchy, downstream of maternal gradients such as that of Caudal (Cad). We use data-driven mathematical modelling and phase space analysis to show that shifting gap domains in the posterior half of the Drosophila embryo are an emergent property of a robust damped oscillator mechanism, suggesting that the regulatory dynamics underlying long- and short-germband segmentation are much more similar than previously thought. In Tribolium, Cad has been proposed to modulate the frequency of the segmentation oscillator. Surprisingly, our simulations and experiments show that the shift rate of posterior gap domains is independent of maternal Cad levels in Drosophila. Our results suggest a novel evolutionary scenario for the short- to long-germband transition and help explain why this transition occurred convergently multiple times during the radiation of the holometabolan insects.


Conflict of interest statement

The authors have declared that no competing interests exist.

Figures

Fig 1
Fig 1. Dynamics of gap gene pattern formation in Drosophila melanogaster.
(A) Gap protein expression data (colored areas) and model output (dots), shown at cleavage cycle 13 (C13) and 14A (C14A, time classes T4 and T8). Hb is in yellow, Kr in green, Kni in red, Gt in blue (see key). See S1 Data for the whole data set, previously published in [32]. X-axes: % A–P position (where 0% is the anterior pole); y-axes: relative protein concentration (in au’s). Dashed vertical line indicates bifurcation boundary between static and shifting gap domain borders (at 52% A–P position). (B) Dynamical regimes governing gap gene expression in the anterior versus the posterior of the embryo. Static anterior boundaries are set by attractors in a multi-stable regime, as shown in the stylized phase portrait on the left. In this region, initial concentrations of maternal factors determine which basin of attraction a given nucleus will eventually fall into. It will either converge towards a high Hb and Gt state, a high Hb and Kr state, or a high Kr-only state. Shifting posterior boundaries are driven by a damped oscillator regulatory mechanism. This mechanism is implemented by a mono-stable spiral sink, a single stable state towards which spiralling trajectories converge. These are arranged around a color wheel that illustrates the different states composing the oscillator. The spiral sink is represented by the central black dot. Trajectories are represented by black curves with transient dynamics shown as solid, and asymptotic convergence is indicated by dotted curves. As in the anterior trunk region of the embryo, initial concentrations of maternal factors—Hb in particular—determine the starting points of the trajectories. (See text for details). A–P, anteroposterior; au, arbitrary unit; Conc., concentration; Gt, Giant; Hb, Hunchback; Kni, Knirps; Kr, Krüppel; Rel., relative.
Fig 2
Fig 2. A damped oscillator governs posterior gap gene patterning in Drosophila melanogaster.
(A) Kinematic gap domain shifts and temporal order of gene expression. Temporal dynamics of gap gene expression in posterior nuclei between 55% and 73% A–P position, shown as columns. Developmental time proceeds down the y-axis, covering cleavage cycles 13 (C13) and 14A (C14A; subdivided into time classes T1–T8). C12 shows initial conditions: maternally provided Hb concentrations indicated by yellow shading at the top of each column. Kr concentration is shown in shades of green, Kni in red, and Gt in blue. The kinematic anterior shift of the Kni domain (in red) is clearly visible. Color wheels (at the bottom of the columns) represent ordered succession of gap gene expression imposed by the damped oscillator mechanism. Black arrows indicate the section (phase range) of the clock period that the oscillator traverses in each nucleus over the duration of the blastoderm stage. The position of each arrow depends on the initial Hb concentration in that nucleus. See S1 Data, previously published in [32]. (B) Three-dimensional projection of the time-variable phase portrait for the nucleus at 59% A–P position. Axes represent Kr, Kni, and Gt protein concentrations; Hb is present at low levels only early on and is not shown. Spiral sinks are represented by cylinders and are color coded to show the associated developmental time point (see key). The simulated trajectory of the system during C13 and C14A is shown in black (see model parameters in S1 Table); colored points on the trajectory mark its progress through time. Asymptotic convergence of the trajectory (after the blastoderm stage has ended) is shown in gray. S1 Movie shows an animated rotation of this phase portrait to clarify the position of the trajectory in three-dimensional space. (C) Simulated trajectories for nuclei between 53% and 71% A–P position. Projection, axes, and time points as in (B). S2 Movie shows an animated rotation of this graph to clarify the position of trajectories in three-dimensional space. (D) Simulated trajectories for the nuclei between 53% and 73% A–P position are represented unfolded onto the Kr-Kni and Gt-Kni planes, to which they are restricted (see Fig 2C and S2 Movie). Time points as in (B). A–P position of each nucleus in (C) and (D) is given by the shade of gray of the trajectory: lighter colored trajectories correspond to more posterior nuclei (see key). Note that trajectories in (C) and (D) emerge from the same point because initial concentrations of Kr, Kni, and Gt are all zero; Hb is not shown in these panels because it is present as a maternal contribution only in the depicted nuclei. The star marks the nucleus at 59% A–P position. See Materials and methods for time classes and main text for further details. A–P, anteroposterior; Gt, Giant; Hb, Hunchback; Kni, Knirps; Kr, Krüppel.
Fig 3
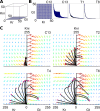
Fig 3. Canalizing properties and relaxation-like behavior of the gap gene damped oscillator.
(A, B) Canalizing properties: trajectories rapidly converge to the Kr-Kni and Kni-Gt planes in phase space. We simulated the nonautonomous diffusion-less circuit in the nucleus at 59% A–P position with Kni concentration fixed to zero and a set of initial conditions that were regularly distributed on the Kr-Gt plane. (A) Initial conditions shown in blue, embedded within the three-dimensional Kr-Kni-Gt space. (B) Two-dimensional projections of the Kr-Gt plane show converging system states as tiny blue dots at the end of cleavage cycle 12 (C12, initial conditions), cleavage cycle 13 (C13), as well as cleavage cycle 14A (C14A, time classes T1 and T8). (C) Fast-slow dynamics in posterior nuclei are caused by relaxation-like behavior. Unfolded, two-dimensional projections of the Kr-Kni and Kni-Gt planes are shown, as in Fig 2D at C13, C14A-T2, T4, and T6. Colored arrows indicate magnitude and direction of flow: large red arrows represent strong flow and small blue arrows represent weak flow. Simulated trajectories of posterior nuclei are superimposed on the flow (shown as black lines). Colored circles at the end of trajectories indicate current state at each time point. Stars mark trajectories experiencing a positive Gt component of the flow. See main text for further details. Gt, Giant; Kni, Knirps; Kr, Krüppel.
Fig 4
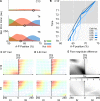
Fig 4. Gap domain shifts are robust towards changes in Cad concentration.
(A) Posterior gap gene expression data at cleavage cycle 13 (C13), and cleavage cycle 14A (C14A, time classes T4 and T8). Black circles mark the Kr-Gt border interface. Y-axes show gap protein concentration in au’s. X-axes represent relative A–P position (where 0% is the anterior pole). (B) Space-time plot shows temporal shift of the Kr-Gt border interface in simulations with variable levels of Cad (see key and main text). Reduced levels of Cad cause a delayed onset of shifts between C13 and C14A-T1, while shift rates remain unaffected at later time points (T1–T8). Y-axis represents time (increasing downwards). X-axes represent relative A–P position, as in (A). Gray shaded area indicates time points compared to data in Fig 5. (C, D) Stereotypical fast-slow dynamics for posterior nuclei simulated with a WT Cad profile and with a reduced Cad profile multiplied by a factor of 0.8. Unfolded, two-dimensional projections of the Kr-Kni and Kni-Gt planes are shown, as in Fig 3C, at C12 and C14A-T8. Colored arrows indicate magnitude and direction of flow. Magnitude is color coded: red represents strong flow and blue represents weak flow. (E) Gray shading indicates differences of flow magnitude between (C) and (D) (see key). Changes in flow direction are small (S3 Fig). Thus, we keep arrow size small in (C) and (D) in order to emphasize changes in flow magnitude. See main text for further details. A–P, anteroposterior; au, arbitrary unit; Cad, Caudal; Conc., concentration; Gt, giant; Kr; Krüppel; Prot., protein; Rel. relativeed; WT, wild-type.
Fig 5
Fig 5. Shifts of the posterior gt domain are delayed in embryos lacking maternal cad.
(A) Space-time plot comparing median wild-type boundary position (gray) to median boundary position in embryos mutant for cadmat (blue colored lines). Time is shown increasing down the y-axis (from cleavage cycle 13 [C13] to time class 4 in cleavage cycle 14A [C14-T4]). The x-axis represents relative A–P position (where 0% is the anterior pole). The initial position of the anterior boundary of the posterior gt domain (simulated in Fig 4B) is identical in wild type and mutants (arrowhead). Between time classes C13 and T1, this boundary becomes displaced posteriorly in the mutants. During later stages (T1–T8), this displacement is kept more or less constant, indicating that shift rates are very similar in wild type and mutants. Horizontal bars show median-absolute deviations of the data at every time point. (B) Summary graphs comparing individual wild-type gt boundary positions (gray) to gt boundary positions in cadmat mutant embryos (blue colored lines). Boundary expression levels are normalized to [0, 1] (y-axis). In both panels, the trunk region is shown from 35% to 90% A–P position (x-axes). A subset of the data shown here has been published previously [39]. See S5 Fig for example embryo images. The full data set is available on figshare: https://figshare.com/s/839791c208e42b7e61fe. A–P, anteroposterior; cad, caudal; cadmat, maternal cad mutant; gt, giant; wt, wild-type.

Similar articles

Cited by

References

    1. Sander K. Specification of the basic body pattern in insect embryogenesis. Advances in Insect Physiology. 1976;12:124.
    1. Davis GK, Patel NH. Short, long, and beyond: molecular and embryological approaches to insect segmentation. Annual Review of Entomology. 2002;47:669–699. doi: 10.1146/annurev.ento.47.091201.145251 - DOI - PubMed
    1. Rosenberg MI, Lynch JA, Desplan C. Heads and tails: evolution of antero-posterior patterning in insects. Biochimica et Biophysica Acta (BBA)-Gene Regulatory Mechanisms. 2009;1789:333–42. - PMC - PubMed
    1. Lynch JA, El-Sherif E, Brown SJ. Comparisons of the embryonic development of Drosophila, Nasonia, and Tribolium. Wiley Interdisciplinary Reviews: Developmental Biology. 2012;1:16–39. doi: 10.1002/wdev.3 - DOI - PMC - PubMed
    1. Akam M. The molecular basis for metameric pattern in the Drosophila embryo. Development. 1987;101:1–22. - PubMed

Publication types

MeSH terms

Substances