. 2018 Feb 16;14(2):e1006004.
doi: 10.1371/journal.pcbi.1006004. eCollection 2018 Feb.

Trade-off between synergy and efficacy in combinations of HIV-1 latency-reversing agents

Affiliations

Trade-off between synergy and efficacy in combinations of HIV-1 latency-reversing agents

Vipul Gupta et al. PLoS Comput Biol. .

Abstract

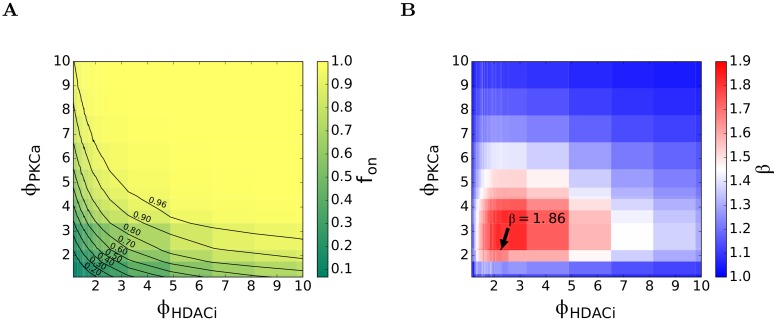
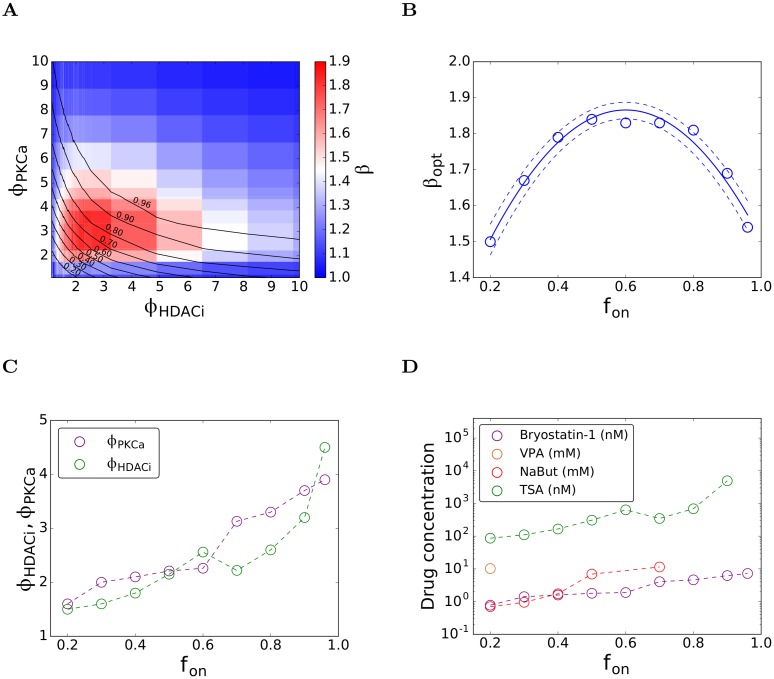
Eradicating HIV-1 infection is difficult because of the reservoir of latently infected cells that gets established soon after infection, remains hidden from antiretroviral drugs and host immune responses, and retains the capacity to reignite infection following the cessation of treatment. Drugs called latency-reversing agents (LRAs) are being developed to reactivate latently infected cells and render them susceptible to viral cytopathicity or immune killing. Whereas individual LRAs have failed to induce adequate reactivation, pairs of LRAs have been identified recently that act synergistically and hugely increase reactivation levels compared to individual LRAs. The maximum synergy achievable with LRA pairs is of clinical importance, as it would allow latency-reversal with minimal drug exposure. Here, we employed stochastic simulations of HIV-1 transcription and translation in latently infected cells to estimate this maximum synergy. We incorporated the predominant mechanisms of action of the two most promising classes of LRAs, namely, protein kinase C agonists and histone deacetylase inhibitors, and quantified the activity of individual LRAs in the two classes by mapping our simulations to corresponding in vitro experiments. Without any adjustable parameters, our simulations then quantitatively captured experimental observations of latency-reversal when the LRAs were used in pairs. Performing simulations representing a wide range of drug concentrations, we estimated the maximum synergy achievable with these LRA pairs. Importantly, we found with all the LRA pairs we considered that concentrations yielding the maximum synergy did not yield the maximum latency-reversal. Increasing concentrations to increase latency-reversal compromised synergy, unravelling a trade-off between synergy and efficacy in LRA combinations. The maximum synergy realizable with LRA pairs would thus be restricted by the desired level of latency-reversal, a constrained optimum we elucidated with our simulations. We expect this trade-off to be important in defining optimal LRA combinations that would maximize synergy while ensuring adequate latency-reversal.


Conflict of interest statement

The authors have declared that no competing interests exist.

Figures

Fig 1
Fig 1. Schematic of the HIV-1 latency circuit.
The events associated with HIV-1 transcription and translation that govern the latency of an HIV-1 infected cell are depicted as a set of reactions (see Eqs (1)–(18) in Methods). The entities involved in the reactions are described in Results and the rate constants of the reactions are in Table 1.
Fig 2
Fig 2. Basal reactivation of latently infected cells.
Time-evolution of protein copy numbers in latently infected cells obtained by stochastic simulations of the HIV-1 latency circuit (Methods) in the absence of intervention. Trajectories (lines) of each of the 2000 cells in one realization are shown. Those crossing the activation threshold of 500 copies (dashed line) are in purple and the rest in grey. The parameters employed for the simulations except kNFκB and kBasal are in Table 1. The values of the latter parameters and the resulting percentage activation, fon, are: (A) kNFκB = 9 × 10⁻⁵ molecules s-1 and kBasal = 6.14 × 10⁻³ s-1 yielding fon = 0.0395; (B) kNFκB = 10−4 molecules s-1 and kBasal = 6.14 × 10⁻³ s-1 yielding fon = 0.0475; (C) kNFκB = 9 × 10⁻⁵ molecules s-1 and kBasal = 7 × 10⁻³ s-1 yielding fon = 0.053; and (D) kNFκB = 10−4 molecules s-1 and kBasal = 7 × 10⁻³ s-1 yielding fon = 0.0656.
Fig 3
Fig 3. Influence of PKC agonists on latent cell reactivation.
(A) The fraction of cells reactivated, fon, as a function of the fold-increase, ϕPKCa, in the rate of NF-κB synthesis, predicted using our stochastic simulations (Methods). Representative realizations showing the time-evolution of protein copy numbers in activated (purple) and latent (grey) cells with (B) ϕPKCa = 1.76 yielding fon = 0.1 and (C) ϕPKCa = 3.87 yielding fon = 0.38. The remaining parameters are in Table 1. (D) Dose-response curve for bryostatin-1 obtained by mapping ϕPKCa to the dosage [D] (symbols) that yield the measured fon [33] (Inset). The best-fit of the Hill equation (Eq (22)) (solid line) and the 95% confidence interval (dashed lines) are also shown. The best-fit parameter estimates are ϕ0 = 5.3 ± 0.3 and ϕM = 6 ± 2 nM (R2 = 0.98).
Fig 4
Fig 4. Influence of HDACi’s on latent cell reactivation.
(A) The fraction of cells reactivated, fon, as a function of the fold-increase, ϕHDACi, in the rate of HIV-1 transcription, predicted using our stochastic simulations (Methods). Representative realizations showing the time-evolution of protein copy numbers in activated (purple) and latent (grey) cells with (B) ϕHDACi = 1.24 yielding fon = 0.066 and (C) ϕHDACi = 1.36 yielding fon = 0.0825. The remaining parameters are in Table 1. Dose-response curves for (D) VPA, (E) NaBut, and (F) TSA, obtained by mapping ϕHDACi to the dosage [D] (symbols) that yield the measured fon [33] (Insets). The best-fits of the Hill equation (Eq (22)) (solid line) and the 95% confidence interval (dashed lines) are also shown. The best-fit parameter estimates are (D) ϕ0 = 0.57 ± 0.08, ϕM = 1.4 ± 0.5 mM (R2 = 0.98); (E) ϕ0 = 1.35 ± 0.08, ϕM = 1.1 ± 0.2 mM (R2 = 0.99); and (F) ϕ0 = 2.3 ± 0.4, ϕM = 300 ± 100 nM (R2 = 0.99).
Fig 5
Fig 5. Co-stimulation with PKC agonists and HDACi’s.
The fraction of cells reactivated, fon, following simultaneous exposure to 1 nM (blue) or 10 nM (red) bryostatin-1 and (A) VPA, (B) NaBut, and (C) TSA, observed experimentally [33] (symbols) and predicted by our simulations (lines). The values of ϕPKCa and ϕHDACi corresponding to the individual drug concentrations employed were obtained from the dose-response curves in Figs 3 and 4, respectively. Simulations based on confidence limits on these parameter values yielded 95% confidence limits on our predictions (shaded regions). All the other parameters are in Table 1.
Fig 6
Fig 6. Synergy between PKC agonists and HDACi’s.
(A) The fraction of cells reactivated, fon predicted by our simulations for different values of ϕPKCa and ϕHDACi, the fold-increase in the rate of NF-κB synthesis and HIV-1 transcription due to a PKC agonist and an HDACi, respectively. The lines are contours of constant fon. (B) The corresponding synergy between the drugs, β, predicted using Eqs (19)–(21). The maximum synergy is indicated.
Fig 7
Fig 7. Drug concentrations yielding maximum synergy.
Synergy as a function of the concentrations of bryostatin-1 and (A) VPA, (B) NaBut, and (C) TSA, obtained by mapping ϕPKCa and ϕHDACi in Fig 6B to drug concentrations using the dose-response curves in Figs 3 and 4. The maximum synergy attainable is indicated.
Fig 8
Fig 8. The synergy-efficacy trade-off.
(A) The contours of constant fon (Fig 6A) superimposed on the synergy heatmap (Fig 6B). (B) The maximum synergy as a function of fon demonstrating the synergy-efficacy trade-off (symbols). The line is a quadratic fit to guide the eye. (C) The values of ϕPKCa and ϕHDACi that maximize β as functions of fon and (D) the associated drug concentrations estimated using the dose-response curves (Figs 3 and 4).

Similar articles

Cited by

References

    1. Archin NM, Sung JM, Garrido C, Soriano-Sarabia N, Margolis DM. Eradicating HIV-1 infection: seeking to clear a persistent pathogen. Nat Rev Microbiol. 2014;12:750–64. doi: 10.1038/nrmicro3352 - DOI - PMC - PubMed
    1. Finzi D, Blankson J, Siliciano JD, Margolick JB, Chadwick K, Pierson T, et al. Latent infection of CD4+ T cells provides a mechanism for lifelong persistence of HIV-1, even in patients on effective combination therapy. Nat Med. 1999;5:512–7. doi: 10.1038/8394 - DOI - PubMed
    1. Joos B, Fischer M, Kuster H, Pillai SK, Wong JK, Boni J, et al. HIV rebounds from latently infected cells, rather than from continuing low-level replication. Proc Natl Acad Sci U S A. 2008;105:16725–30. doi: 10.1073/pnas.0804192105 - DOI - PMC - PubMed
    1. Ho YC, Shan L, Hosmane NN, Wang J, Laskey SB, Rosenbloom DI, et al. Replication-competent noninduced proviruses in the latent reservoir increase barrier to HIV-1 cure. Cell. 2013;155:540–51. doi: 10.1016/j.cell.2013.09.020 - DOI - PMC - PubMed
    1. Whitney JB, Hill AL, Sanisetty S, Penaloza-MacMaster P, Liu J, Shetty M, et al. Rapid seeding of the viral reservoir prior to SIV viraemia in rhesus monkeys. Nature. 2014;512:74–7. doi: 10.1038/nature13594 - DOI - PMC - PubMed

Publication types