

The ARID1A, p53 and ß-Catenin statuses are strong prognosticators in clear cell and endometrioid carcinoma of the ovary and the endometrium
- PMID: 29451900
- PMCID: PMC5815611
- DOI: 10.1371/journal.pone.0192881
The ARID1A, p53 and ß-Catenin statuses are strong prognosticators in clear cell and endometrioid carcinoma of the ovary and the endometrium
Abstract
Aim: The objective of this study was to evaluate the prognostic value of ARID1A, p53, p21, p16 and ß-Catenin in endometrioid and clear cell ovarian and endometrial carcinomas.
Materials and methods: 97 tumors were available for analysis of ARID1A, p53, p21, p16 and ß-Catenin with the techniques of tissue microarray and immunohistochemistry. 32 were ovarian carcinomas and 65 were endometrial carcinomas.
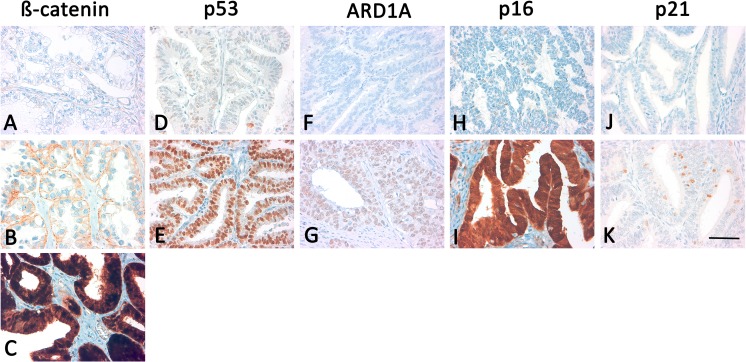
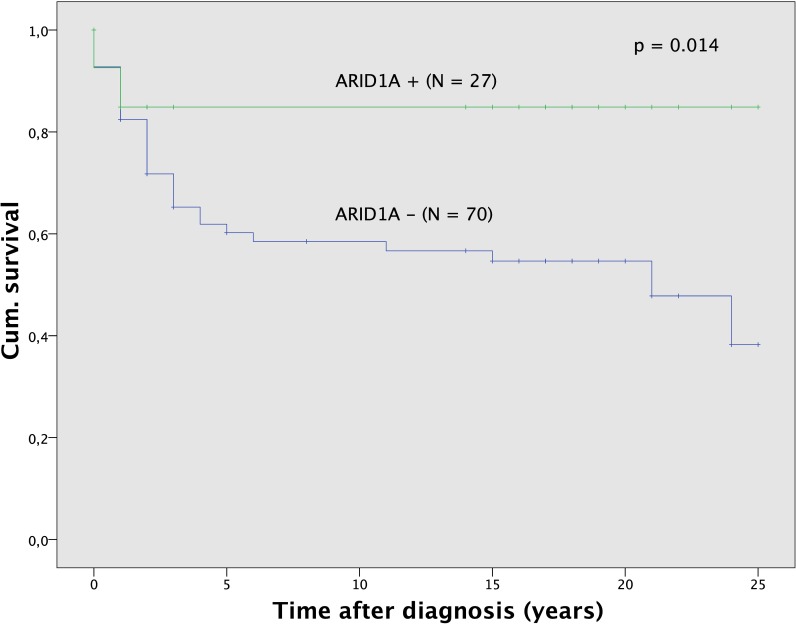
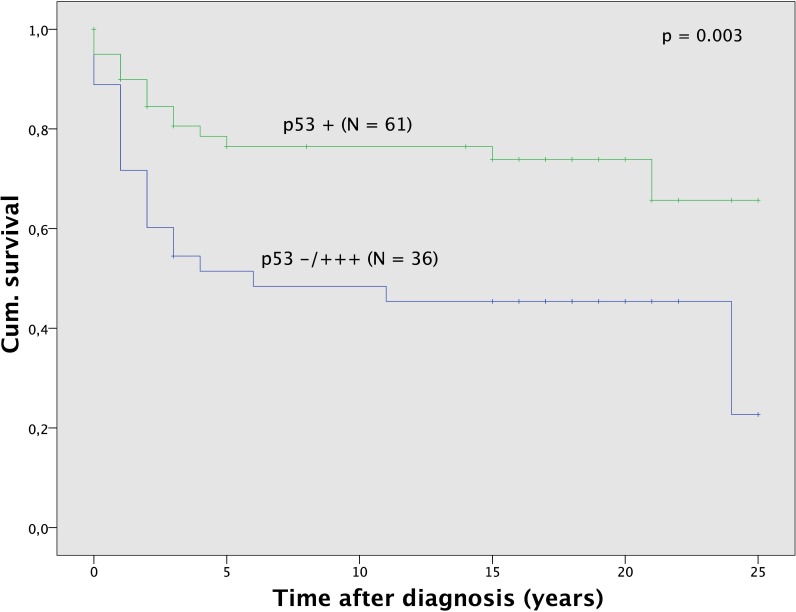
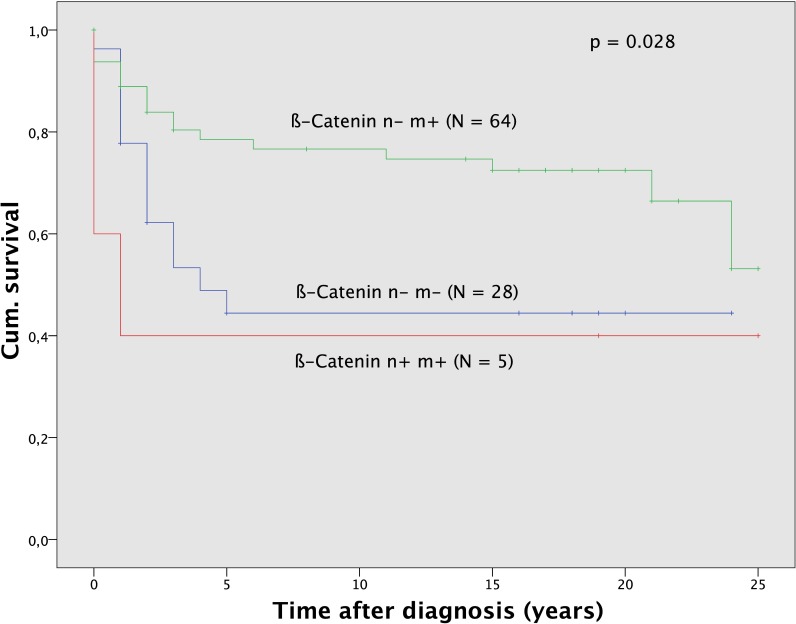
Results: Endometrioid ovarian carcinomas showed negative staining for ARID1A (a) and p21 (b), aberrant expression of p53 (c) and p16 (d) and ß-Catenin positive nuclear expression (e) respectively in 19% (a), 100% (b), 28.6% (c), 52.4% (d) and 4.8% (e) of all cases. In the group of clear cell ovarian carcinomas it was 63.6% (a), 100% (b), 81.8% (c), 54.5% (d) and 0% (e). For endometrioid uterine carcinomas it was 75.7% (a), 94.9% (b), 30.5% (c), 52.1% (d) and 6.8% (e) and for clear cell uterine carcinomas it was 8.6% (a), 100% (b), 50% (c), 100% (d) and 0% (e). Survival analysis showed that negative expression of ARID1A, p53 aberrant expression and ß-Catenin nuclear positive staining are independent negative prognosticators in both, clear cell and endometrioid carcinoma, regardless of ovarian or uterine origin. Cox-Regression analysis showed them again as negative prognostic factors. Furthermore, we found a significant correlation between ARID1A and ß-Catenin expression in endometrioid uterine tumors.
Conclusion: The analyzed gynaecological carcinoma showed a distinct expression scheme of proteins that are associated with tumor suppression. We may conclude that ARID1A, p53 and ß-Catenin are the strongest prognostic factors by analyzing a subgroup of tumor suppressor genes in clear cell and endometrioid subtypes of ovarian and endometrial cancer and may be used along with traditional morphological and clinical characteristics for prognosis.
Conflict of interest statement
Figures
References
-
- Kurman RJ, Caracangiu ML, Herrington CS, Young RH (2014) International Agency for Research on Cancer, World Health Organization WHO classification of tumours of female reproductive organs France: Lyon: International Agency for Research on Cancer, 2014.
-
- Cho KR, Shih IeM (2009) Ovarian cancer. Annu Rev Pathol 4: 287–313. doi: 10.1146/annurev.pathol.4.110807.092246 - DOI - PMC - PubMed
-
- Crum CP, Drapkin R, Miron A, Ince TA, Muto M, Kindelberger DW et al. (2007) The distal fallopian tube: a new model for pelvic serous carcinogenesis. Curr Opin Obstet Gynecol 19: 3–9. doi: 10.1097/GCO.0b013e328011a21f - DOI - PubMed
-
- Piek JM, Verheijen RH, Kenemans P, Massuger LF, Bulten H, van Diest PJ (2003) BRCA1/2-related ovarian cancers are of tubal origin: a hypothesis. Gynecol Oncol 90: 491. - PubMed
Publication types
MeSH terms
Substances
LinkOut - more resources
Full Text Sources
Other Literature Sources
Medical
Research Materials
Miscellaneous
