. 2018 Jun:106:88-100.
doi: 10.1016/j.exger.2018.02.002. Epub 2018 Feb 13.

Repetitive TLR3 activation in the lung induces skeletal muscle adaptations and cachexia

Affiliations

Repetitive TLR3 activation in the lung induces skeletal muscle adaptations and cachexia

Ted G Graber et al. Exp Gerontol. 2018 Jun.

Abstract

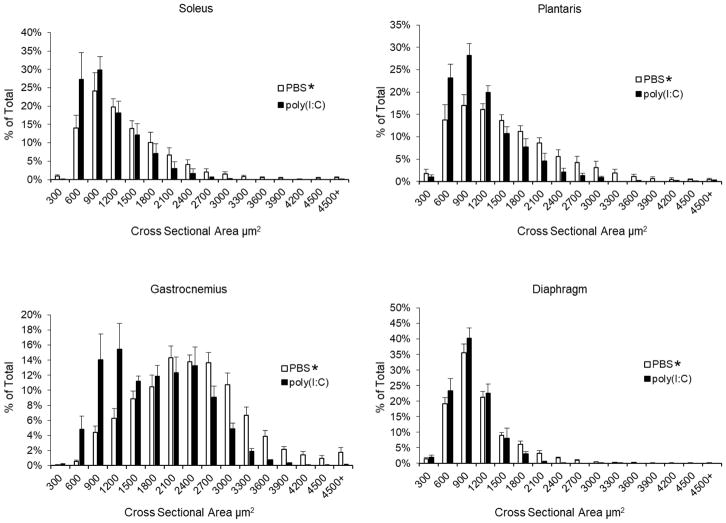
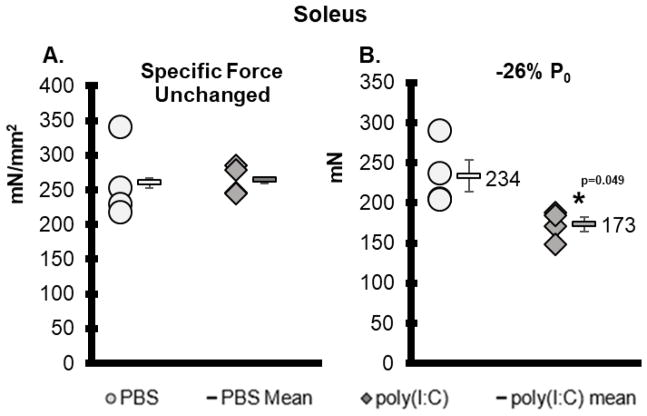
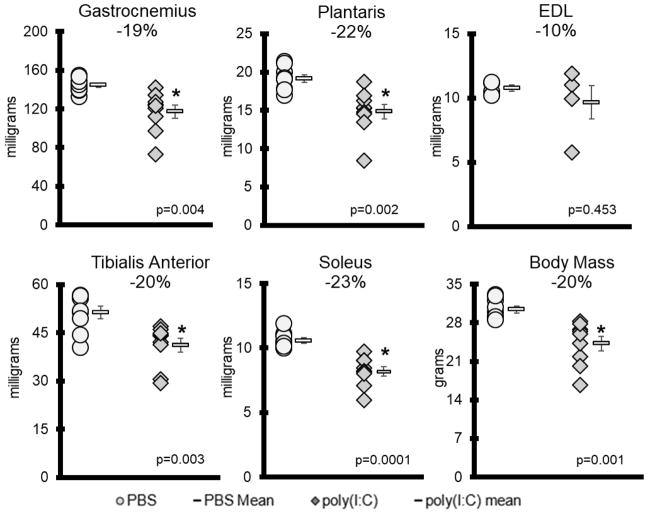
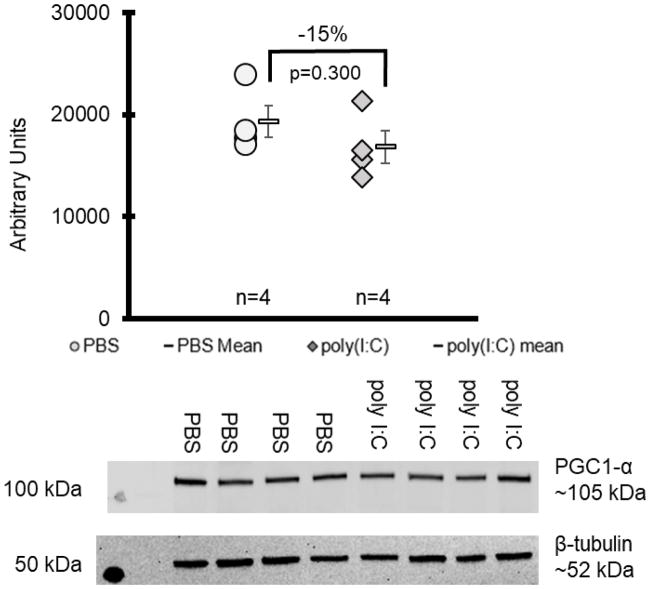
Due to immunosenescence, older adults are particularly susceptible to lung-based viral infections, with increased severity of symptoms in those with underlying chronic lung disease. Repeated respiratory viral infections produce lung maladaptations, accelerating pulmonary dysfunction. Toll like 3 receptor (TLR3) is a membrane protein that senses exogenous double-stranded RNA to activate the innate immune response to a viral infection. Polyinosinic-polycytidylic acid [poly(I:C)] mimics double stranded RNA and has been shown to activate TLR3. Utilizing an established mouse viral exacerbation model produced by repetitive intranasal poly(I:C) administration, we sought to determine whether repetitive poly(I:C) treatment induced negative muscle adaptations (i.e. atrophy, weakness, and loss of function). We determined skeletal muscle morphological properties (e.g. fiber-type, fiber cross-sectional area, muscle wet mass, etc.) from a treated group ((poly(I:C), n = 9) and a sham-treated control group (PBS, n = 9); age approximately 5 months. In a subset (n = 4 for both groups), we determined in vivo physical function (using grip test for strength, rotarod for overall motor function, and treadmill for endurance) and muscle contractile properties with in vitro physiology (in the EDL, soleus and diaphragm). Our findings demonstrate that poly(I:C)-treated mice exhibit both muscle morphological and functional deficits. Changes of note when comparing poly(I:C)-treated mice to PBS-treated controls include reductions in fiber cross-sectional area (-27% gastrocnemius, -25% soleus, -16% diaphragm), contractile dysfunction (soleus peak tetanic force, -26%), muscle mass (gastrocnemius -19%, soleus -23%), physical function (grip test -34%), body mass (-20%), and altered oxidative capacity (140% increase in succinate dehydrogenase activity in the diaphragm, but 66% lower in the gastrocnemius). Our data is supportive of a new model of cachexia/sarcopenia that has potential for future research into the mechanisms underlying muscle wasting.

Keywords: Ageing; COPD cachexia; Mouse models; Physical function; Skeletal muscle; TLR3.


Conflict of interest statement

Conflicts of Interest:

The authors report no conflicts of interest whether financial or otherwise.

Figures

Figure A1
Figure A1. Pooled Distributions by Muscle
Error bars equal standard error of the percent of total from each measured muscle (n=9 for each group, except for diaphragm with n=4 per group). * = statistically significant differences in pooled distributions with p<0.05 (see Table A1 for exact statistics).
Figure 1
Figure 1. Study Design
C57BL/6 mice at approximately 5 months of age were subjected to n=15 challenges with intranasal poly(I:C) (polyinosinic-polycytidylic acid), or PBS (phosphate buffered saline), every other day for a total of 30 days. One week after the last poly(I:C) treatment, the mice were tested for function with the rotarod (overall motor function), treadmill (endurance), and grip test (forelimb strength). Two weeks after last poly(I:C) treatment, tissue was harvested for contractile physiology and downstream experimentation.
Figure 2
Figure 2. Repetitive Poly(I:C) Treatment Induces Airway Remodeling
Lung morphological changes: alveolar destruction, thickening and hypercellularity of the alveolar septa. Masson Trichrome staining of lung sections from PBS treated (left panel) or poly(I:C)-treated mice (middle and right panels). The lung histological images were shown at magnifications of 100X, 200x, and 400X respectively.
Figure 3
Figure 3. Functional Measurements
A. No Change in Rotarod (overall motor function). B. Treadmill (endurance) tended to be reduced by 42% in poly(I:C). C. Grip (forelimb strength) was 34% lower in poly(I:C). Each symbol [circle (PBS) or diamond (poly(I:C)] = one mouse. Rectangles = means. Error bars on means = standard error. * = p<0.05.
Figure 4
Figure 4. Muscle Contractile Function in Soleus
A. Specific Force Unchanged B. −26% Peak tetanic isometric force (P0) in poly(I:C). Each symbol [circle (PBS) or diamond (poly(I:C)] = one muscle from one mouse. Rectangles = means. Error bars on means = standard error. mN=milliNewton, * = p<0.05.
Figure 5
Figure 5. Muscle Wet Mass
In 4 of the 5 muscles examined there was significant atrophy with poly(I:C) treatment. Body mass was also decreased. EDL had n=4 per group, but all others had n=9 per group. EDL= extensor digitorum longus, TA = Tibialis Anterior. Each symbol [circle (PBS) or diamond (poly(I:C)] = one mouse, rectangles = means. Error bars on means = standard error. * Significant effect of poly(I:C) treatment (p<0.05).
Figure 6
Figure 6. Muscle Fiber Cross-Sectional Area
A. Average muscle fiber CSA measured in μm2. * Significant effect of poly(I:C) treatment (p<0.05). * Significant effect of poly(I:C) treatment (p<0.05). Each symbol [circle (PBS) or diamond (poly(I:C)] indicates count from an individual muscle sample, rectangle = mean value, error bars = standard error. B. Representative images (top poly(I:C), bottom PBS) demonstrating glycosaminoglycan used to assess gastrocnemius muscle fiber cross-sectional area (CSA).
Figure 7
Figure 7. Muscle Fiber Type
A. Relative distribution of fiber type in the diaphragm. * Significant effect of poly(I:C) treatment (p<0.05). Each symbol [circle (PBS) or diamond (poly(I:C)], indicates count from an individual muscle sample, rectangle = mean value, error bars= standard error. B. Representative image demonstrating fiber type in mouse gastrocnemius muscle [myosin isoforms: Type 1 (pink), Type 2a (green), Type 2b (red), Type 2x (black)].
Figure 8
Figure 8. Succinate Dehydrogenase
A. Percentage of total cell count reported. Positivity equals increased activity thus more relative oxidative phosphorylation B. Succinate dehydrogenase (SDH) mitochondrial enzyme (TCA cycle) enzymatic stain, representative image demonstrating SDH staining to assess oxidative capacity. Fibers were scored as strongly positive (++), weakly positive (+) or negative (−). Scale bar = 100μm. * Significant effect of poly(I:C) treatment (p<0.05).
Figure 9
Figure 9. Capillary and Arteriole Density
Representative images of PBS-treated (A.) and poly(I:C)-treated (B.) mouse diaphragm denoting skeletal muscle capillaries (red), arterioles (green) and laminin (white). C. Average capillary density in various muscles as capillaries per fiber. D. Average arteriole density in various muscles as arterioles per 100 fibers. * = significant effect of poly(I:C) treatment (p<0.05). Each symbol [circle PBS, diamond poly(I:C)] = data calculated from one cross section of an individual muscle, rectangle = mean, error bars = standard error.
Figure 10
Figure 10. PGC-1α not affected by poly(I:C) treatment in Gastroc
A. PGC-1α is a marker of mitochondrial biogenesis, less relative amount is indicative of a more glycolytic muscle. n=4 per group. B. Representative Image. Electrophoresis for PGC-1α and β-tubulin run on 4–15% Acrylamide Gel, 50 μg of protein from gastrocnemius whole muscle homogenate per lane. Blot made on PVDF membrane, 1:1000 1 ° Ab, 1:2000 2° Ab. Blot was stripped and reprobed for β-tubulin load control. Each symbol, circle or diamond, indicates PGC-1α relative density for an individual muscle sample, kDa= kilodalton.

References

    1. Abramson MJ, Perret JL, Dharmage SC, McDonald VM, McDonald CF. Distinguishing adult-onset asthma from COPD: a review and a new approach. International Journal of Chronic Obstructive Pulmonary Disease. 2014;9:945–962. doi: 10.2147/COPD.S46761. - DOI - PMC - PubMed
    1. Adeloye D, Chua S, Lee C, et al. Global and regional estimates of COPD prevalence: Systematic review and meta–analysis. Journal of Global Health. 2015;5(2):020415. doi: 10.7189/jogh.05-020415. - DOI - PMC - PubMed
    1. Aeffner F, Traylor ZP, Yu EN, Davis IC. Double-stranded RNA induces similar pulmonary dysfunction to respiratory syncytial virus in BALB/c mice. Am J Physiol Lung Cell Mol Physiol. 2011 Jul;301(1):L99–L109. doi: 10.1152/ajplung.00398.2010. Epub 2011 Apr 8. - DOI - PubMed
    1. Austin S, St-Pierre J. PGC1α and mitochondrial metabolism – emerging concepts and relevance in ageing and neurodegenerative disorders. J Cell Sci. 2012;(125):4963–4971. doi: 10.1242/jcs.113662. - DOI - PubMed
    1. Barnes PJ, Celli BR. Systemic manifestations and comorbidities of COPD. European Respiratory Journal. 2009;33(5):1165–1185. doi: 10.1183/09031936.00128008. - DOI - PubMed

Publication types