

PHF20 collaborates with PARP1 to promote stemness and aggressiveness of neuroblastoma cells through activation of SOX2 and OCT4
- PMID: 29452418
- PMCID: PMC5951121
- DOI: 10.1093/jmcb/mjy007
PHF20 collaborates with PARP1 to promote stemness and aggressiveness of neuroblastoma cells through activation of SOX2 and OCT4
Abstract
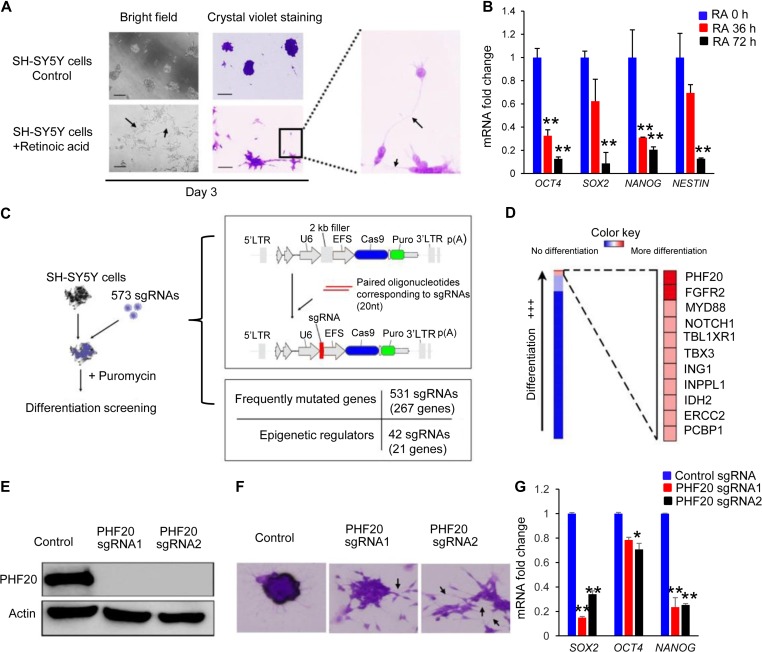
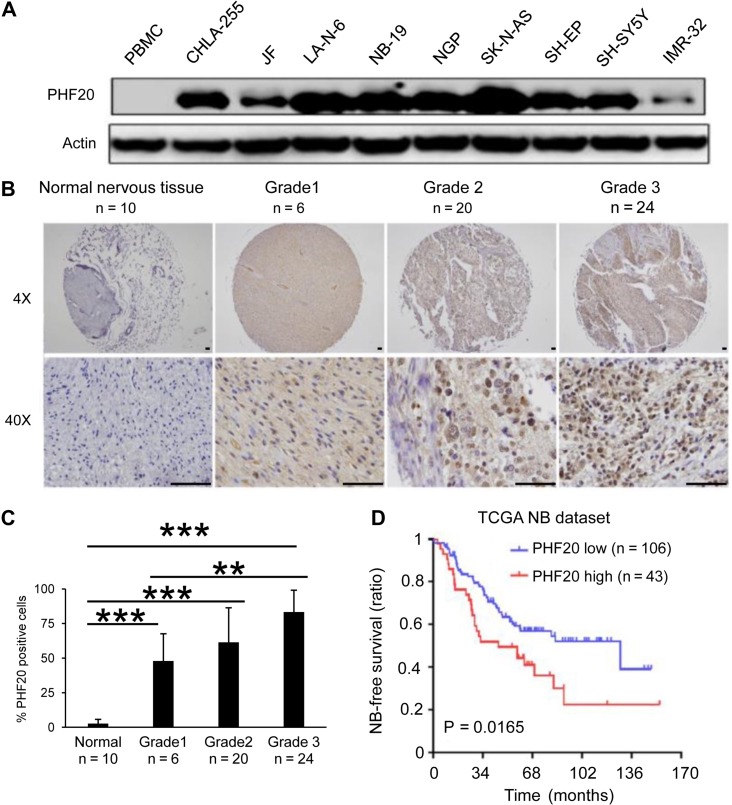
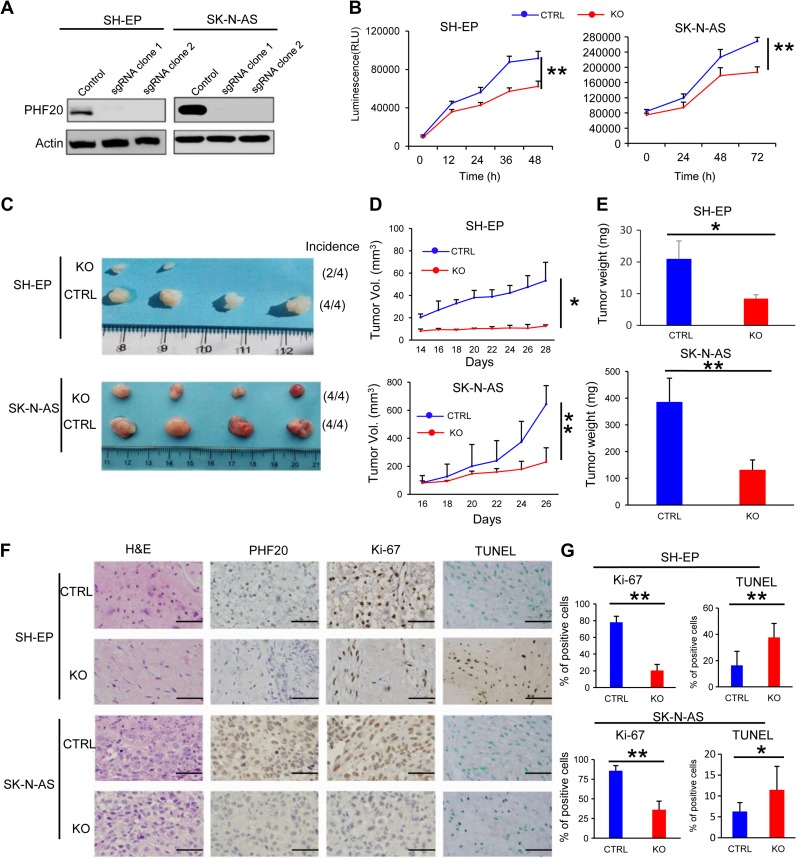
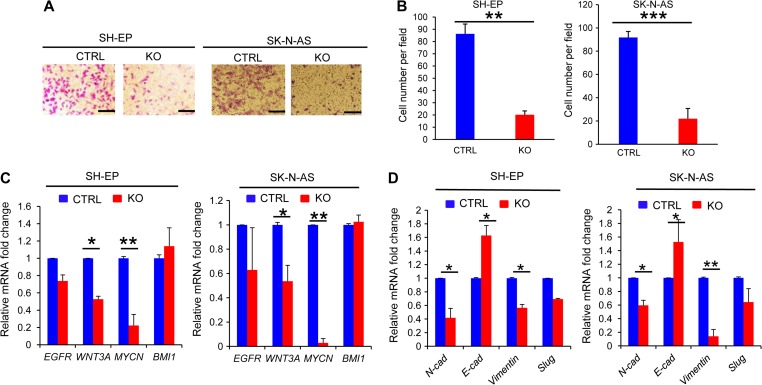
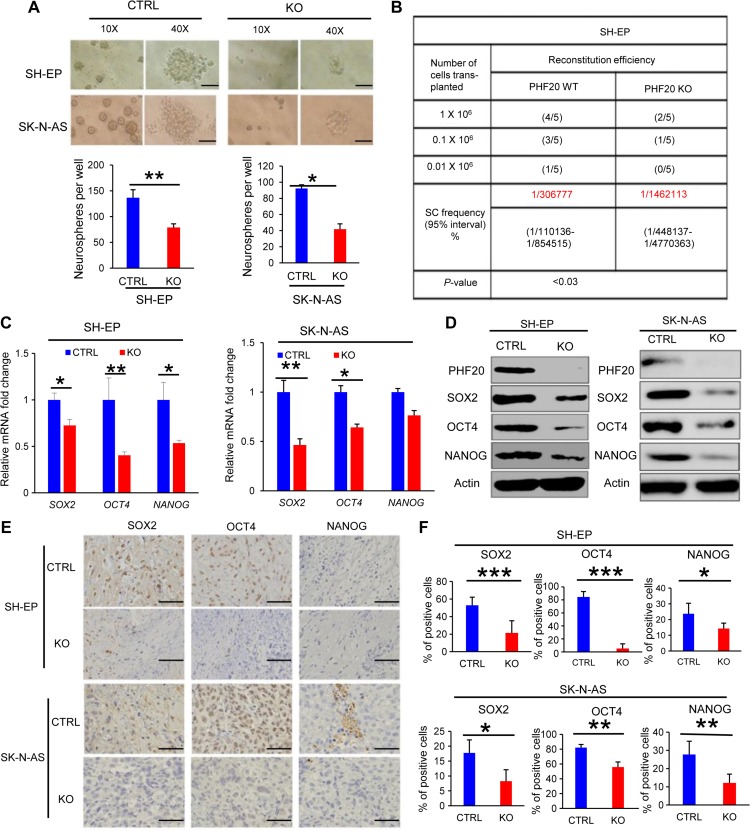
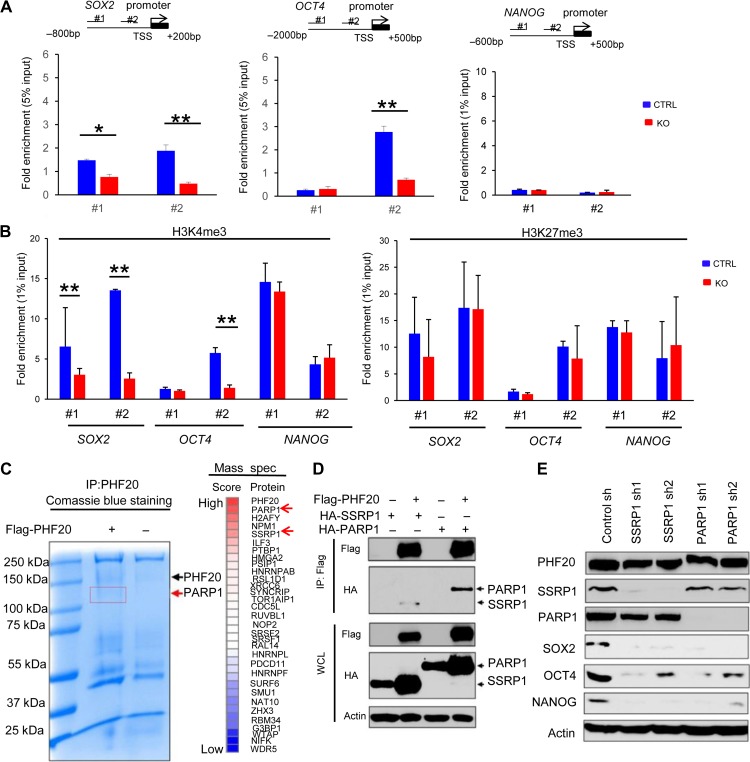
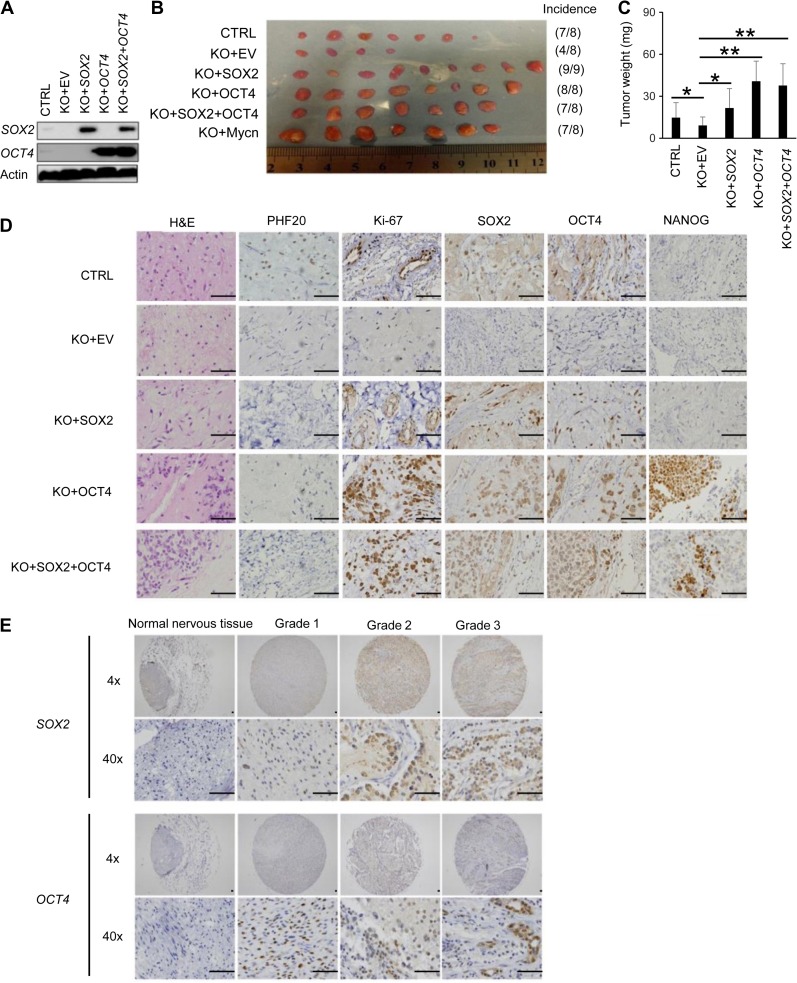
The differentiation status of neuroblastoma (NB) strongly correlates with its clinical outcomes; however, the molecular mechanisms driving maintenance of stemness and differentiation remain poorly understood. Here, we show that plant homeodomain finger-containing protein 20 (PHF20) functions as a critical epigenetic regulator in sustaining stem cell-like phenotype of NB by using CRISPR/Cas9-based targeted knockout (KO) for high-throughput screening of gene function in NB cell differentiation. The expression of PHF20 in NB was significantly associated with high aggressiveness of the tumor and poor outcomes for NB patients. Deletion of PHF20 inhibited NB cell proliferation, invasive migration, and stem cell-like traits. Mechanistically, PHF20 interacts with poly(ADP-ribose) polymerase 1 (PARP1) and directly binds to promoter regions of octamer-binding transcription factor 4 (OCT4) and sex determining region Y-box 2 (SOX2) to modulate a histone mark associated with active transcription, trimethylation of lysine 4 on histone H3 protein subunit (H3K4me3). Overexpression of OCT4 and SOX2 restored growth and progression of PHF20 KO tumor cells. Consistently, OCT4 and SOX2 protein levels in clinical NB specimens were positively correlated with PHF20 expression. Our results establish PHF20 as a key driver of NB stem cell-like properties and aggressive behaviors, with implications for prognosis and therapy.
Figures
Similar articles
-
Oct4 and Sox2 are overexpressed in human neuroblastoma and inhibited by chemotherapy.Oncol Rep. 2012 Jul;28(1):186-92. doi: 10.3892/or.2012.1765. Epub 2012 Apr 20. Oncol Rep. 2012. PMID: 22576801
-
Retracted: Risk-Associated Long Noncoding RNA FOXD3-AS1 Inhibits Neuroblastoma Progression by Repressing PARP1-Mediated Activation of CTCF.Mol Ther. 2018 Mar 7;26(3):755-773. doi: 10.1016/j.ymthe.2017.12.017. Epub 2017 Dec 22. Mol Ther. 2018. Retraction in: Mol Ther. 2023 Jun 7;31(6):1857. doi: 10.1016/j.ymthe.2023.05.001. PMID: 29398485 Free PMC article. Retracted.
-
YY1 drives PARP1 expression essential for PARylation of NONO in mRNA maturation during neuroblastoma progression.J Transl Med. 2024 Dec 27;22(1):1153. doi: 10.1186/s12967-024-05956-4. J Transl Med. 2024. PMID: 39731187 Free PMC article.
-
Crosstalks between Raf-kinase inhibitor protein and cancer stem cell transcription factors (Oct4, KLF4, Sox2, Nanog).Tumour Biol. 2017 Apr;39(4):1010428317692253. doi: 10.1177/1010428317692253. Tumour Biol. 2017. PMID: 28378634 Review.
-
Yin Yang 1 is associated with cancer stem cell transcription factors (SOX2, OCT4, BMI1) and clinical implication.J Exp Clin Cancer Res. 2016 May 25;35:84. doi: 10.1186/s13046-016-0359-2. J Exp Clin Cancer Res. 2016. PMID: 27225481 Free PMC article. Review.
Cited by
-
Targeting the epigenome of cancer stem cells in pediatric nervous system tumors.Mol Cell Biochem. 2023 Oct;478(10):2241-2255. doi: 10.1007/s11010-022-04655-2. Epub 2023 Jan 13. Mol Cell Biochem. 2023. PMID: 36637615 Review.
-
Mechanisms involved in selecting and maintaining neuroblastoma cancer stem cell populations, and perspectives for therapeutic targeting.World J Stem Cells. 2021 Jul 26;13(7):685-736. doi: 10.4252/wjsc.v13.i7.685. World J Stem Cells. 2021. PMID: 34367474 Free PMC article. Review.
-
A comprehensive pan-cancer analysis unveiling the oncogenic effect of plant homeodomain finger protein 14 (PHF14) in human tumors.Front Genet. 2023 Mar 10;14:1073138. doi: 10.3389/fgene.2023.1073138. eCollection 2023. Front Genet. 2023. PMID: 37007943 Free PMC article.
-
ALS-Associated E478G Mutation in Human OPTN (Optineurin) Promotes Inflammation and Induces Neuronal Cell Death.Front Immunol. 2018 Nov 14;9:2647. doi: 10.3389/fimmu.2018.02647. eCollection 2018. Front Immunol. 2018. PMID: 30519240 Free PMC article.
-
Cancer Stem Cells and Immunosuppressive Microenvironment in Glioma.Front Immunol. 2018 Dec 21;9:2924. doi: 10.3389/fimmu.2018.02924. eCollection 2018. Front Immunol. 2018. PMID: 30619286 Free PMC article. Review.
References
-
- Bankovic J., Stojsic J., Jovanovic D., et al. . (2010). Identification of genes associated with non-small-cell lung cancer promotion and progression. Lung Cancer 67, 151–159. - PubMed
-
- Barski A., Cuddapah S., Cui K., et al. . (2007). High-resolution profiling of histone methylations in the human genome. Cell 129, 823–837. - PubMed
-
- Blanc E., Goldschneider D., Douc-Rasy S., et al. . (2005). Wnt-5a gene expression in malignant human neuroblasts. Cancer Lett. 228, 117–123. - PubMed
Publication types
MeSH terms
Substances
Grants and funding
LinkOut - more resources
Full Text Sources
Other Literature Sources
Medical
Molecular Biology Databases
Research Materials
Miscellaneous
