. 2018 Jul;32(7):3623-3640.
doi: 10.1096/fj.201701176R. Epub 2018 Feb 8.

Serum vitamin C levels modulate the lifespan and endoplasmic reticulum stress response pathways in mice synthesizing a nonfunctional mutant WRN protein

Affiliations

Serum vitamin C levels modulate the lifespan and endoplasmic reticulum stress response pathways in mice synthesizing a nonfunctional mutant WRN protein

Lucie Aumailley et al. FASEB J. 2018 Jul.

Abstract

Werner syndrome (WS) is a premature aging disorder caused by mutations in a RecQ-family DNA helicase (WRN). Mice lacking part of the helicase domain of the WRN ortholog exhibit several phenotypic features of WS. In this study, we generated a Wrn mutant line that, like humans, relies entirely on dietary sources of vitamin C (ascorbate) to survive, by crossing them to mice that lack the gulonolactone oxidase enzyme required for ascorbate synthesis. In the presence of 0.01% ascorbate (w/v) in drinking water, double-mutant mice exhibited a severe reduction in lifespan, small size, sterility, osteopenia, and metabolic profiles different from wild-type (WT) mice. Although increasing the dose of ascorbate to 0.4% improved dramatically the phenotypes of double-mutant mice, the metabolic and cytokine profiles were different from age-matched WT mice. Finally, double-mutant mice treated with 0.01% ascorbate revealed a permanent activation of all the 3 branches of the ER stress response pathways due to a severe chronic oxidative stress in the ER compartment. In addition, markers associated with the ubiquitin-proteasome-dependent ER-associated degradation pathway were increased. Augmenting the dose of ascorbate reversed the activation of this pathway to WT levels rendering this pathway a potential therapeutic target in WS.-Aumailley, L., Dubois, M. J., Brennan, T. A., Garand, C., Paquet, E. R., Pignolo, R. J., Marette, A., Lebel, M. Serum vitamin C levels modulate the lifespan and endoplasmic reticulum stress response pathways in mice synthesizing a nonfunctional mutant WRN protein.

Keywords: Werner syndrome; aging; ascorbate; gulonolactone oxidase; metabolomic.


Conflict of interest statement

This work was supported by funding from the Canadian Institutes of Health Research (to M.L. and A.M.), and by U.S. National Institutes of Health (NIH) National Institute on Aging Grant R01AG028873 (to R.J.P.). L.A. is a scholar from the Fondation du Centre Hospitalier Universitaire de Québec. The authors declare no conflicts of interest.

Figures

Figure 1
Figure 1
Effect of ascorbate on growth and lifespan of WrnΔhel/Δhel/Gulo−/− mice. A) Percentage of disease-free animals according to age for WT, WrnΔhel/Δhel, Gulo−/−, and WrnΔhel/Δhel/Gulo−/− mice. B) Serum ascorbate levels in different groups of our mouse cohort (n = 6 per group). Bars represent sem. Groups of mice are labeled in the graph: WT, wild type; Wrn, WrnΔhel/Δhel mice; Gulo 0.01% asc: Gulo−/− mice given 0.01% supplemental ascorbate since weaning; Wrn/Gulo 0.01% asc, WrnΔhel/Δhel/Gulo−/− mice given 0.01% ascorbate since weaning; and Wrn/Gulo 0.4% asc, WrnΔhel/Δhel/Gulo−/− mice given 0.4% ascorbate since weaning. C) Correlation of serum ascorbate level and median lifespan. Graph showing the correlation between serum ascorbate level and median lifespan (Pearson’s correlation coefficient r = 0.942; P = 0.017). D) Total body weight of the different groups of mice (n = 10) from the age of 4–16 wk. Bars represent sem. E) Comparison of total body weight (age 4–16 wk) of untreated WT and WrnΔhel/Δhel/Gulo−/− mice treated with either 0.01 or 0.4% ascorbate (n = 10). Bars represent sem. F) Food intake of mice (n = 3–6) at 4 mo of age. Bars represent sem. Groups of mice are labeled as in panel B. *P < 0.044 vs. WT mice; P < 0.011 vs. WrnΔhel/Δhel/Gulo−/− mice given 0.01% supplemental ascorbate (by Tukey test). G) Water consumption of mice (n = 3–6) at 4 mo of age. Bars represent sem. *P < 0.044 vs. WT mice; P < 0.011 vs. WrnΔhel/Δhel/Gulo−/− mice given 0.01% ascorbate (by Tukey test).
Figure 2
Figure 2
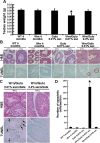
Effect of ascorbate on testicular morphology of WrnΔhel/Δhel/Gulo−/− mice. A) Testicular wet weight of mice (n = 10) at 4 mo of age. *P < 0.019 vs. all other groups of mice (by post-ANOVA Tukey test). B) H&E staining and TUNEL assay of seminiferous tubules of WT, WrnΔhel/Δhel, Gulo−/−, and WrnΔhel/Δhel/Gulo−/− mice at 4 mo of age. Apoptotic cells are circled in red. C) H&E staining and TUNEL assay of seminiferous tubules of WrnΔhel/Δhel/Gulo−/− mice at 4 mo of age treated with 0.01 or 0.4% ascorbate. Apoptotic cells contain a brown precipitate (arrows). D) Average number of apoptotic cells per histologic section of testes from WT (n = 3), WrnΔhel/Δhel (n = 4), Gulo−/− mice treated with 0.01% ascorbate (n = 4), WrnΔhel/Δhel/Gulo−/− mice treated with 0.01% ascorbate (n = 6), and WrnΔhel/Δhel/Gulo−/− mice treated with 0.4% ascorbate (n = 10) at 4 mo of age. *P < 0.001 vs. all other groups of mice (by Tukey test). Bars in graphs represent sem. Groups of mice are labeled as in Fig. 1B.
Figure 3
Figure 3
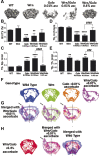
Impact of ascorbate on the hind limb bone structures of WrnΔhel/Δhel/Gulo−/− mice at 3 mo of age. A) Representative 3-dimensional reconstructions of the trabecular region of interest. B) Trabecular bone volume per total bone volume (%). C) Trabecular separation. D) Trabecular number. E) Trabecular thickness. F) Representative cross-sectional images of distal femurs from the indicated genotypes are shown. G) Cross-sectional images of femurs from WrnΔhel/Δhel/Gulo−/− mice treated with 0.01% ascorbate since weaning are overlaid onto WT, WrnΔhel/Δhel, and Gulo−/− mutant slices to illustrate bony abnormalities. Note the unusual distribution of trabecular bone (sequestration of bone toward the left quadrants), and misshapen cortical shell (arrow). H) Cross-sectional images of femurs from WrnΔhel/Δhel/Gulo−/− mice treated with 0.4% ascorbate overlaid onto femurs from WrnΔhel/Δhel/Gulo−/− mice treated with 0.01% ascorbate since weaning and femurs from untreated WT mice. Note that the aberrant features of the WrnΔhel/Δhel/Gulo−/− mutant are absent with the 0.4% ascorbate treatment. Labels in each panel: WT, wild type; Wrn, WrnΔhel/Δhel mice; Gulo, Gulo−/− mice; Wrn/Gulo, WrnΔhel/Δhel/Gulo−/− mice. Bars in graphs represent sem. **P > 0.01; ***P > 0.005; ****P > 0.0001 vs. WT; ###P > 0.005; ####P > 0.0001 Wrn/Gulo 0.01% asc vs. Wrn/Gulo 0.01% asc (by 1-way ANOVA, with Sidak’s multiple comparisons post hoc test).
Figure 4
Figure 4
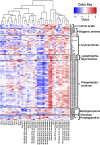
Heat map depicting the z score of the log base 10 in serum metabolites concentration (rows) between individual (columns) WT and mutant mice treated with different amounts of ascorbate. Columns are reordered by hierarchical clustering using the genotype and ascorbate treatments. Metabolites are grouped according to chemical classification. Young (4 mo) WT mice are labeled WT.i (where i = 1–6). Old (20 mo) WT mice are labeled Old WT.i. WrnΔhel/Δhel mice are labeled Wrn.i. Gulo−/− mice treated with 0.01% ascorbate are labeled Gulo 0.01% ascorbate.i. WrnΔhel/Δhel/Gulo−/− mice treated with 0.01% ascorbate are labeled Wrn/Gulo 0.01% ascorbate.i. WrnΔhel/Δhel/Gulo−/− mice treated with 0.4% ascorbate are labeled Wrn/Gulo 0.4% ascorbate.i. The Euclidian distance and complete agglomerative methods were used for clustering.
Figure 5
Figure 5
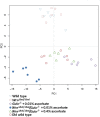
PCA graph demonstrating the differentiation effect of ascorbate and genotype on the metabolomic profiles of mice. X axis: principal component 1; Y axis: principal component 2.
Figure 6
Figure 6
Impact of ascorbate and genotype on the cytokinome of mice. A) Heat map depicting the z score of log base 10 in serum cytokine concentrations (rows) between individual (columns) WT and mutant mice treated with different amounts of ascorbate. Significantly altered cytokines with a value of P < 0.01 are shown. Columns are reordered by hierarchical clustering by using the genotype and ascorbate treatments. The Euclidian distance and complete agglomerative methods were used for clustering. B) PCA graph demonstrating the differentiation effect of ascorbate and genotype on the cytokinome profiles of mice. The labels and symbols on the heat map and the PCA graph are identical to Figs. 4A and 5, respectively.
Figure 7
Figure 7
Ratios of metabolite significantly altered in WrnΔhel/Δhel/Gulo−/− mice. A) Met-SO:Met ratio. *P = 0.046 vs. WT mice (by post-ANOVA Tukey test). B) Free carnitine (C0):acylcarnitine ratio. *P < 0.012 vs. all other groups of mice and P = 0.001 vs. WrnΔhel/Δhel/Gulo−/− mice given 0.01% supplemental ascorbate (by Tukey test). C) Saturated:unsaturated phosphatidylcholines ratio. Groups of mice are labeled as in Fig. 1B. *P = 0.021 vs. WT mice and P = 0.027 vs. WrnΔhel/Δhel/Gulo−/− mice given 0.01% supplemental ascorbate (by unpaired Student t tests). Bars represent sem.
Figure 8
Figure 8
ROS levels in total liver extract and the ER enriched fraction of 4-mo-old WrnΔhel/Δhel/Gulo−/− mice. A) ROS levels in total liver extract. *P < 0.05 vs. WT mice and P = 0.01 vs. WrnΔhel/Δhel/Gulo−/− mice given 0.01% supplemental ascorbate, by Tukey test. B) ROS levels in the ER enriched fraction of WT and WrnΔhel/Δhel/Gulo−/− mice given drinking water supplemented with 0.01 or 0.4% ascorbate. P < 0.01 vs. WT mice; P = 0.01 vs. WrnΔhel/Δhel/Gulo−/− mice given 0.01% supplemental ascorbate (by Tukey test). ROS was detected with DCFA and is shown as relative fluorescence units (RFU). Bars in each graph represent sem.
Figure 9
Figure 9
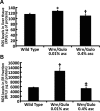
Activation of ER stress protein markers in the liver of 4-mo-old WrnΔhel/Δhel/Gulo−/− mice. A) Western blots for the indicated proteins in 4-mo-old WT and WrnΔhel/Δhel/Gulo−/− mice given supplemental 0.01 or 0.4% ascorbate. B) Ratio of total PERK signal over calreticulin signal in ER enriched fractions from the Western blots. **P < 0.05 compared with WT and WrnΔhel/Δhel/Gulo−/− mice treated with 0.4% ascorbate (by Tukey post-ANOVA test). C) Ratio of total IRE1α signal over calreticulin signal in ER enriched fractions from the Western blots. *P < 0.05 compared with WT mice (by Tukey post-ANOVA test). D) Ratio of CHOP signal over β-actin signal in total liver lysates from the Western blots *P < 0.05 compared with WT mice (by Tukey post-ANOVA test). E) Sum of the cleaved and full-length ATF6 signals in total liver extracts. F) Ratio of the cleaved over total (cleaved and full length) ATF6 signals in total liver extracts. **P < 0.01 compared with WT mice; ††P < 0.01 compared with WT and WrnΔhel/Δhel/Gulo−/− mice treated with 0.01% ascorbate (by Tukey post-ANOVA test). G) Signal of PDI signal over calreticulin signal in ER enriched fractions from the Western blots. *P < 0.05 compared with WT mice (by Tukey post-ANOVA test). H) Ratio of mutant WrnΔhel signal over calreticulin signal in ER enriched fractions from the Western blots. I) Ratio of HERPUD1 signal over β-actin signal in total liver lysates from the Western blots. ††P < 0.01 compared with WT and WrnΔhel/Δhel/Gulo−/− mice treated with 0.4% ascorbate (by Tukey post-ANOVA test). Bars in all histograms represent SEM of 4 mice.
Figure 10
Figure 10
Sulfhydrylation and ubiquitylation modifications of proteins in the liver of 4-mo-old WrnΔhel/Δhel/Gulo−/− mice. A) Ratio of total ubiquitylated proteins signal over β-actin signal from the Western blots. **P < 0.05 compared with WT and WrnΔhel/Δhel/Gulo−/− mice treated with 0.4% ascorbate (by Tukey post-ANOVA test). Bars in all histograms represent sem of 4 mice. B) Quantification of thiol groups on proteins extracted from the liver of WT and WrnΔhel/Δhel/Gulo−/− mice treated with 0.01 and 0.4% ascorbate by the DTNB assay. *P < 0.05; P < 0.01 compared with WrnΔhel/Δhel/Gulo−/− mice treated with 0.4% ascorbate (by Tukey post-ANOVA test).

Similar articles

Cited by

References

    1. Epstein C. J., Martin G. M., Schultz A. L., Motulsky A. G. (1966) Werner’s syndrome a review of its symptomatology, natural history, pathologic features, genetics and relationship to the natural aging process. Medicine (Baltimore) 45, 177–221 https://doi.org/10.1097/00005792-196605000-00001 - DOI - PubMed
    1. Salk D. (1982) Werner’s syndrome: a review of recent research with an analysis of connective tissue metabolism, growth control of cultured cells, and chromosomal aberrations. Hum. Genet. 62, 1–5 https://doi.org/10.1007/BF00295598 - DOI - PubMed
    1. Yu C. E., Oshima J., Fu Y. H., Wijsman E. M., Hisama F., Alisch R., Matthews S., Nakura J., Miki T., Ouais S., Martin G. M., Mulligan J., Schellenberg G. D. (1996) Positional cloning of the Werner’s syndrome gene. Science 272, 258–262 https://doi.org/10.1126/science.272.5259.258 - DOI - PubMed
    1. Ozgenc A., Loeb L. A. (2005) Current advances in unraveling the function of the Werner syndrome protein. Mutat. Res. 577, 237–251 https://doi.org/10.1016/j.mrfmmm.2005.03.020 - DOI - PubMed
    1. Balajee A. S., Machwe A., May A., Gray M. D., Oshima J., Martin G. M., Nehlin J. O., Brosh R., Orren D. K., Bohr V. A. (1999) The Werner syndrome protein is involved in RNA polymerase II transcription. Mol. Biol. Cell 10, 2655–2668 https://doi.org/10.1091/mbc.10.8.2655 - DOI - PMC - PubMed

Publication types

LinkOut - more resources