. 2018 Feb 15;69(4):594-609.e8.
doi: 10.1016/j.molcel.2018.01.023.

Mitochondrial MDM2 Regulates Respiratory Complex I Activity Independently of p53

Affiliations

Mitochondrial MDM2 Regulates Respiratory Complex I Activity Independently of p53

Giuseppe Arena et al. Mol Cell. .

Abstract

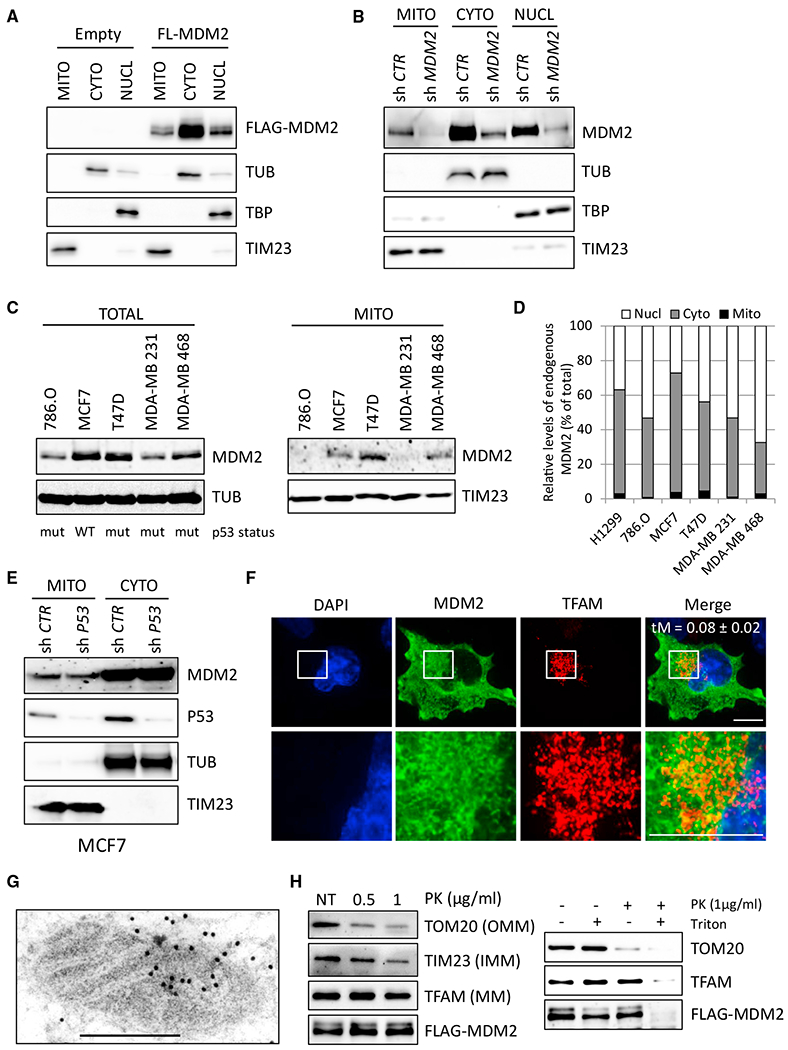
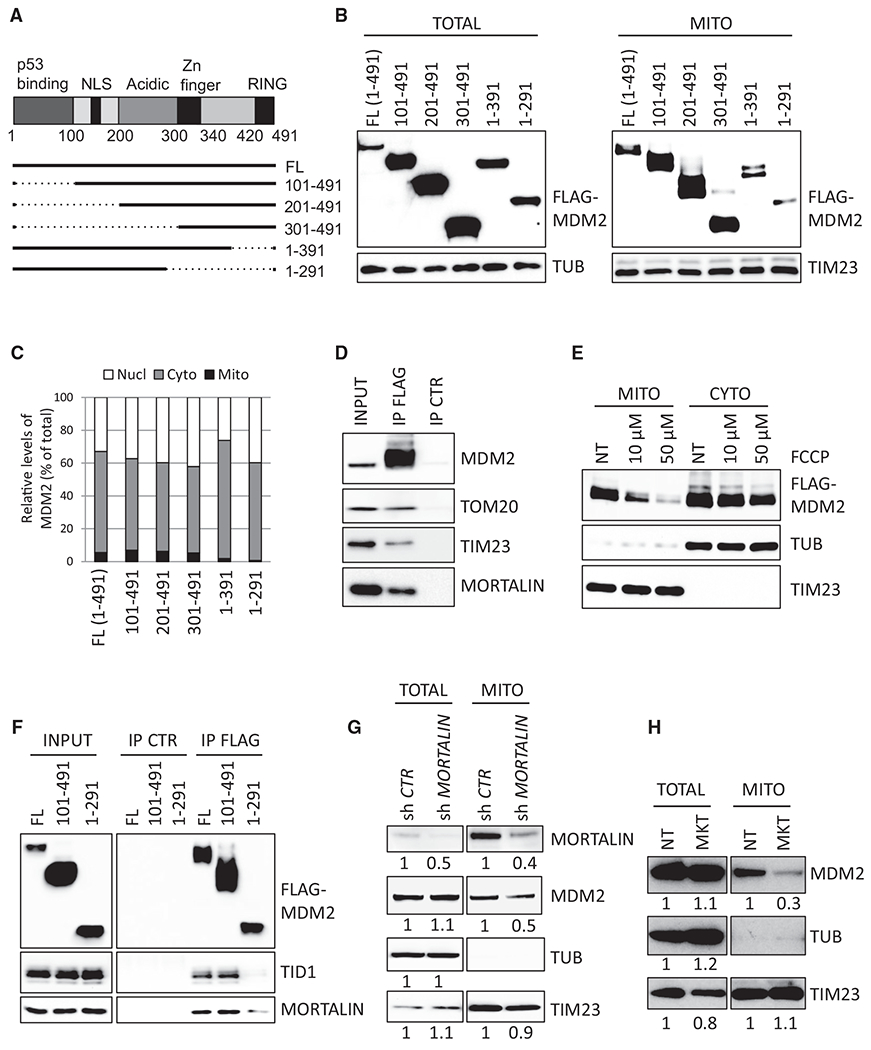
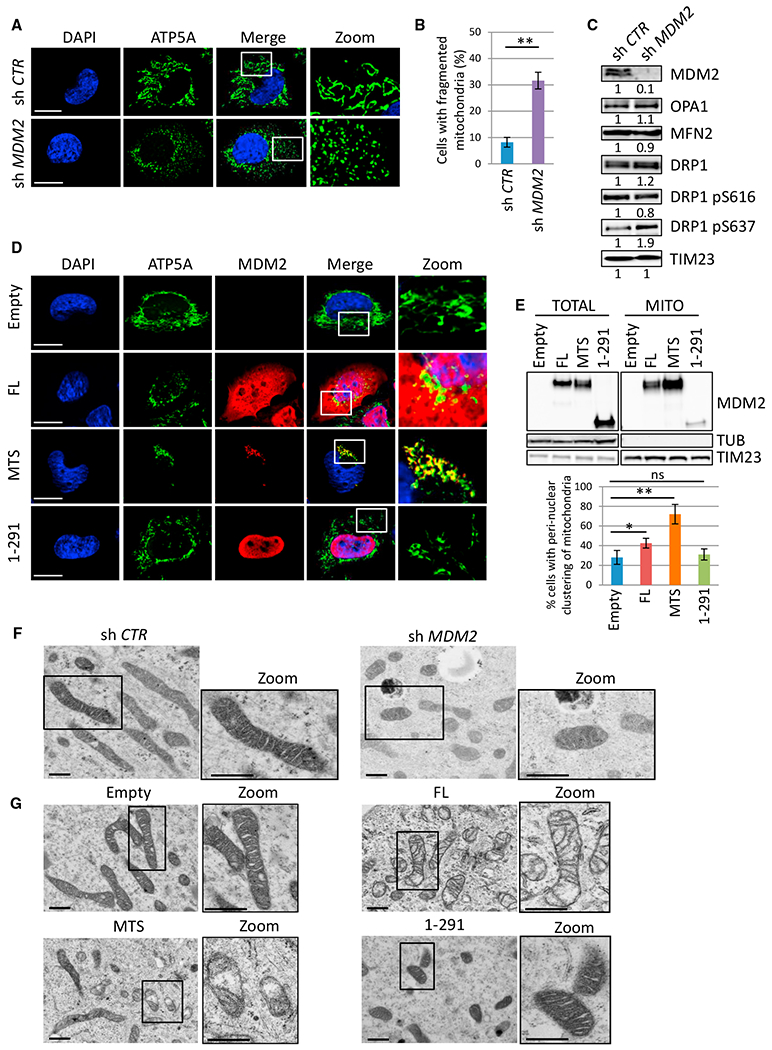
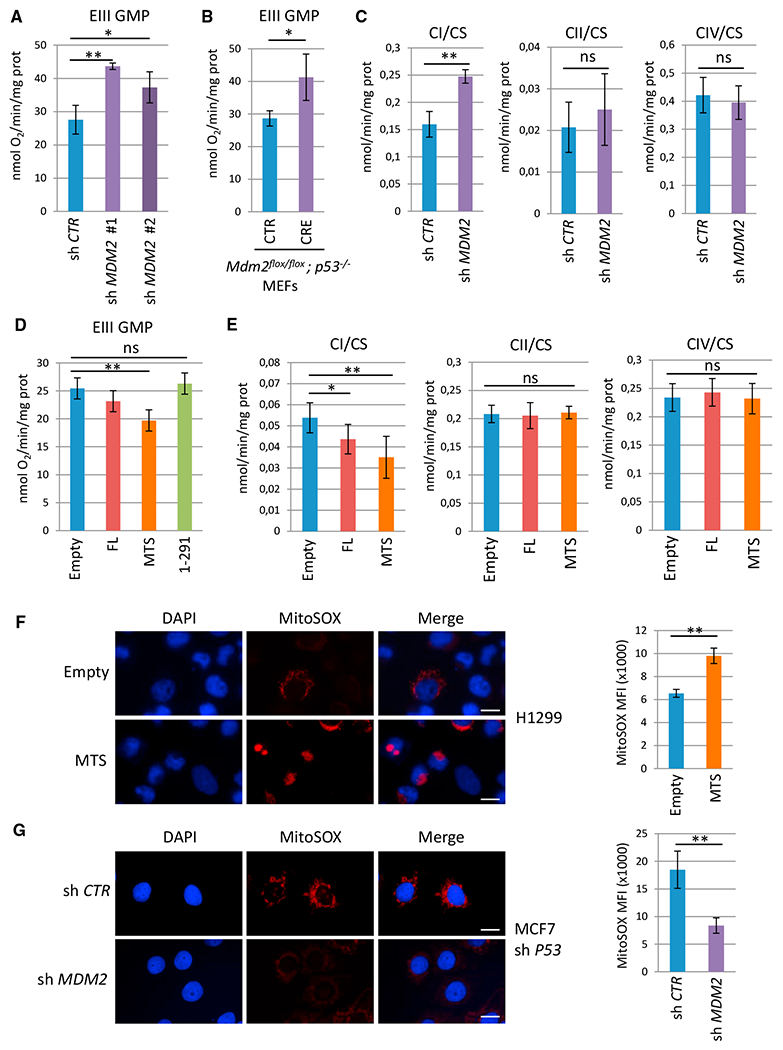
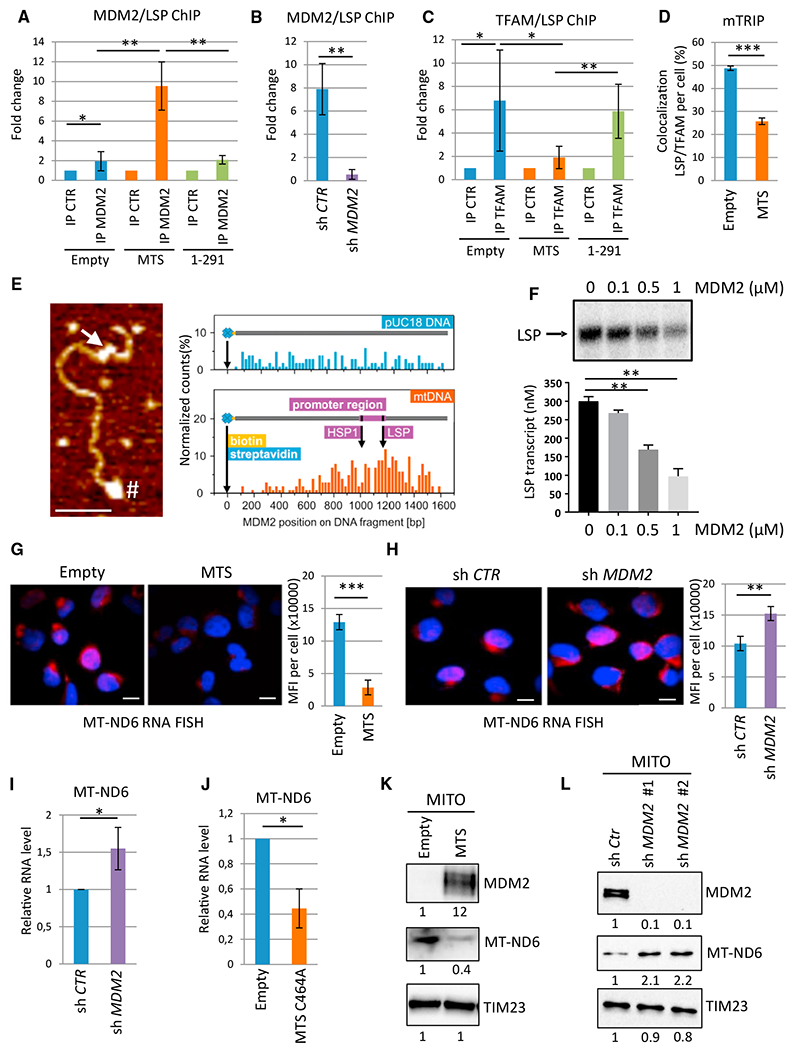
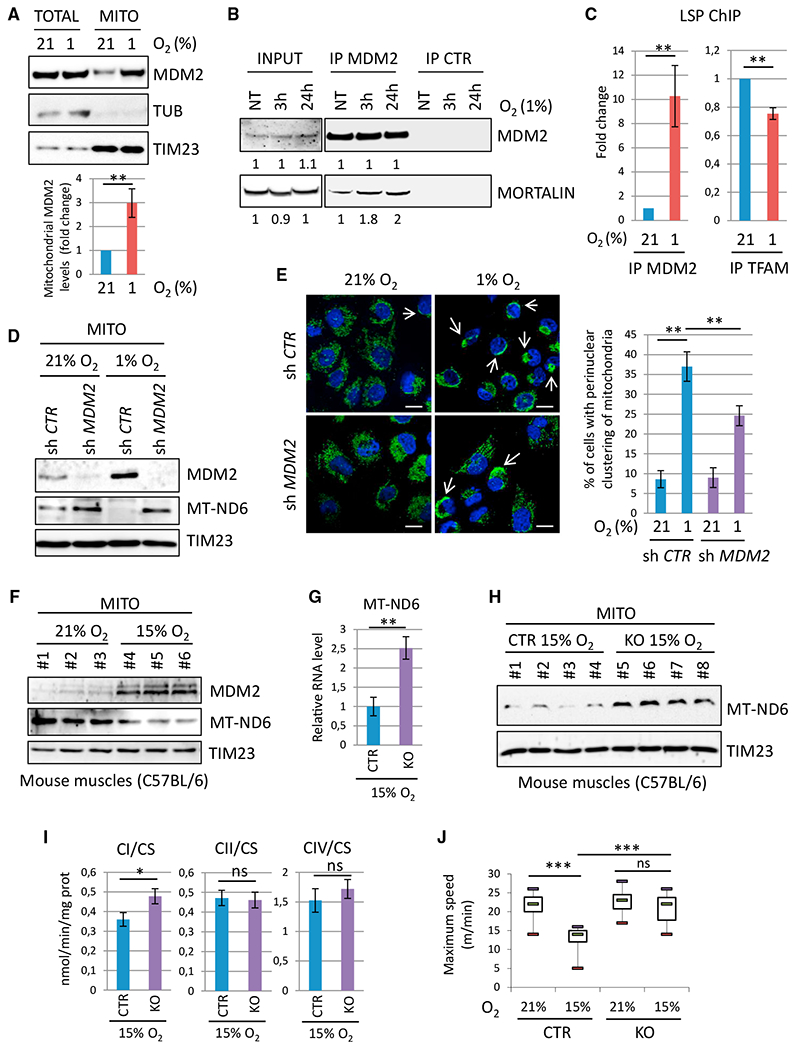
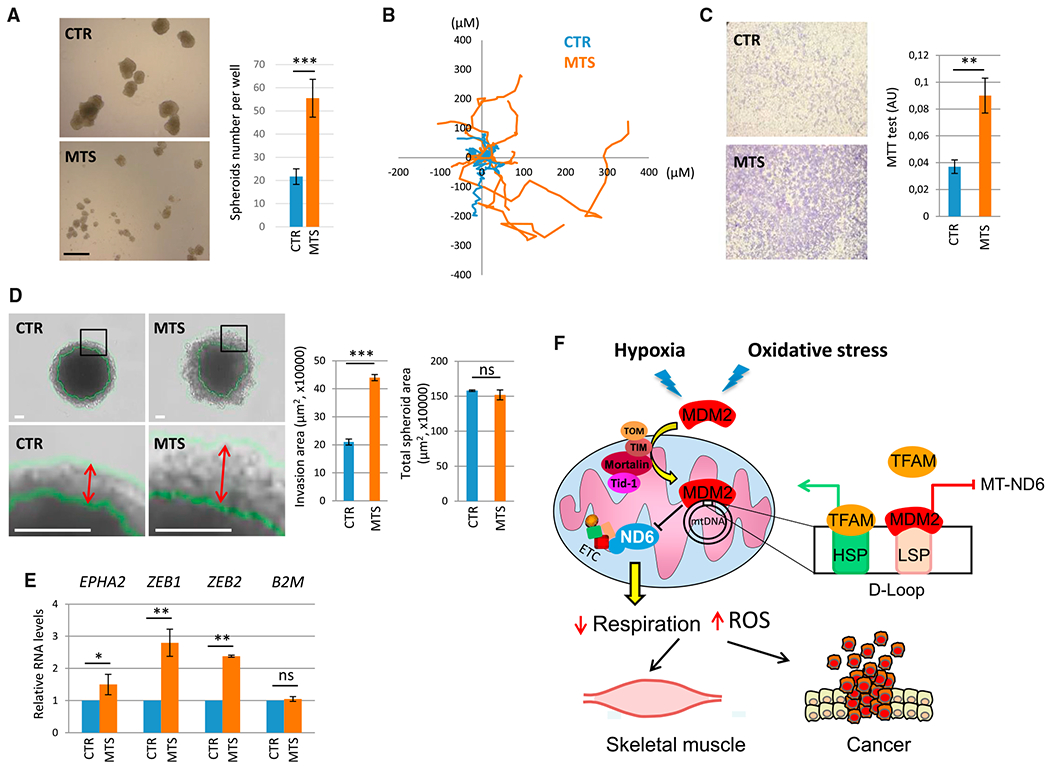
Accumulating evidence indicates that the MDM2 oncoprotein promotes tumorigenesis beyond its canonical negative effects on the p53 tumor suppressor, but these p53-independent functions remain poorly understood. Here, we show that a fraction of endogenous MDM2 is actively imported in mitochondria to control respiration and mitochondrial dynamics independently of p53. Mitochondrial MDM2 represses the transcription of NADH-dehydrogenase 6 (MT-ND6) in vitro and in vivo, impinging on respiratory complex I activity and enhancing mitochondrial ROS production. Recruitment of MDM2 to mitochondria increases during oxidative stress and hypoxia. Accordingly, mice lacking MDM2 in skeletal muscles exhibit higher MT-ND6 levels, enhanced complex I activity, and increased muscular endurance in mild hypoxic conditions. Furthermore, increased mitochondrial MDM2 levels enhance the migratory and invasive properties of cancer cells. Collectively, these data uncover a previously unsuspected function of the MDM2 oncoprotein in mitochondria that play critical roles in skeletal muscle physiology and may contribute to tumor progression.

Keywords: MDM2; MT-ND6; hypoxia; migration; mitochondria; respiratory complex I.


Conflict of interest statement

DECLARATION OF INTERESTS

The authors declare no competing financial interests.

Figures

Figure 1.
Figure 1.. MDM2 Localizes in the Mitochondrial Matrix
(A) Subcellular localization of FLAG-tagged full-length (aa 1–491) MDM2 (FL-MDM2) in H1299 cells. MDM2 levels were determined by immunoblotting of fractions enriched in mitochondrial (MITO), cytosolic (CYTO), and nuclear (NUCL) proteins with an anti-FLAG antibody. Equal loading was verified with TATA binding protein (TBP), tubulin (TUB), and TIM23 protein levels. (B) Immunoblot (IB) analysis of endogenous MDM2 subcellular localization in H1299 cells transduced with lentiviruses expressing control or MDM2 shRNAs. (C) IB analysis of total (left) and mitochondrial (right) endogenous MDM2 levels in different human cancer cell lines. The p53 status of each cell line is indicated: WT or mutant (mut). (D) Quantitative IB analysis of endogenous MDM2 subcellular localization in different human cancer cell lines. Histobars represent the relative levels of nuclear, cytosolic, and mtMDM2 in the indicated cell lines. (E) IB analysis of endogenous MDM2 subcellular localization in MCF7 cells transduced with lentiviruses encoding control or p53 shRNAs. (F) Super-resolution microscopy analysis of FL-MDM2 (green) and TFAM (red) subcellular localization in H1299 cells. Nuclei were stained with DAPI (blue). Scale bars, 10 μM. tM indicates the Manders coefficient representing the colocalization of the signal detected with the anti-FLAG antibody and that detected with the anti-TFAM antibody. (G) Immunogold staining for transmission electron microscopy (TEM) analysis of MDM2 subcellular localization in H1299 cells expressing FL-MDM2. Scale bar, 500 nM. (H) Protease protection assays performed on purified mitochondria isolated from H1299 cells expressing FL-MDM2. Left: IB analysis of MDM2, the outer mitochondrial membrane (OMM) protein TOM20, the inner mitochondrial membrane (IMM) protein TIM23, and the mitochondrial matrix (MM) protein TFAM, after incubation of purified mitochondria with 0.5 or 1 μg/mL PK. NT, mock-treated mitochondria. Right: protease protection assays performed in the presence of the permeabilizing agent Triton X-100. MDM2 and TFAM proteins were only digested in presence of Triton X-100, confirming their localization in the mitochondrial matrix. See also Figure S1.
Figure 2.
Figure 2.. MDM2 Is Actively Imported in Mitochondria through Mitochondrial Transporters
(A) Schematic representation of MDM2 protein structure and of the selected deletion mutants. NLS, nuclear localization signal. (B) Subcellular localization of FL-MDM2 and of the indicated deletion mutants in H1299 cells, determined by IB using anti-FLAG antibody in whole-cell lysates (TOTAL) and in extracts prepared from purified mitochondria (MITO). Equal loading was verified with TUB and TIM23 protein levels. (C) Quantitative IB analysis of the subcellular localization of the indicated MDM2 proteins in H1299 cells. Histobars represent the relative levels of nuclear, cytosolic, and mtMDM2. (D) Co-immunoprecipitation assays showing association between FL-MDM2 and endogenous TOM20, TIM23, and mtHsp70/mortalin proteins in H1299 cells. IP, immunoprecipitation; CTR, control. (E) Subcellular localization of FL-MDM2 in H1299 cells cultured in the presence of the mitochondrial uncoupler FCCP for 12 hr. NT, untreated. MDM2, TUB, and TIM23 protein levels were determined by IB in fractions enriched in cytosolic or MITO proteins. (F) Co-immunoprecipitation assays performed in H1299 cells expressing FL-MDM2 or the indicated MDM2 deletion mutants. (G and H) Quantitative immunoblotting (qIB) analysis of endogenous MDM2 subcellular localization (G) in H1299 cells expressing control or mtHsp70/mortalin shRNAs or (H) in H1299 cells cultured in the presence of the mtHsp70/mortalin pharmacological inhibitor MKT-077 (MKT). See also Figure S2.
Figure 3.
Figure 3.. MDM2 Regulates Mitochondrial Network Dynamics and Mitochondrial Ultrastructure
(A) Microphotographs of H1299 cells transduced with lentiviruses encoding control (sh Ctr) or MDM2 (sh MDM2) shRNAs. Cells were stained using an antibody recognizing the ATP5A subunit of the ATP synthase complex (green) and nuclei with DAPI (blue) and then were analyzed by confocal microscopy. Insets show microphotographs at higher magnification (Zoom). Scale bars, 10 μM. (B) Mitochondrial fragmentation in MDM2-depleted H1299 cells. Histobars represent the frequency of cells exhibiting fragmented mitochondria (mean ± SEM; n = 120 cells from four independent experiments). (C) IB analysis of total and phosphorylated DRP1 (on Serine 616 or 637), OPA1, MFN2, TIM23 (loading control), and MDM2 protein levels in the same cells as in(A) and (B). (D) Confocal microscopy analysis of the mitochondrial network in H1299 cells expressing ectopic FL-MDM2 (FL), MTS-MDM2 (MTS), MDM2 1-291 (1-291), or in control cells transfected with the corresponding empty vector (Empty). ATP5A (green), MDM2 (red) and nuclei (blue). Insets show microphotographs at higher magnification (Zoom). Scale bars, 10 μM. (E) IB analysis (upper panels) of the subcellular localization of the indicated MDM2 proteins in H1299 cells. Histobars (lower panels) represent the percentage of cells exhibiting perinuclear clustering of mitochondria upon expression of the indicated MDM2 proteins in H1299 cells (mean ± SEM; n = 150 cells from five independent experiments). (F and G) TEM analysis of mitochondrial ultrastructure in (F) H1299 cells expressing control (sh Ctr) or MDM2 (sh MDM2) shRNAs and in (G) H1299 cells expressing FL-MDM2 (FL), MTS-MDM2 (MTS), or MDM2 1-291 (1-291) or in control cells (Empty). Insets show representative microphotographs at higher magnification (Zoom). Scale bars, 500 nM. *p ≤ 0.05 and **p ≤ 0.01, indicating statistical significance of the observed differences. ns, not significant. See also Figure S3.
Figure 4.
Figure 4.. mtMDM2 Controls ETC Complex I Activity and Respiration
(A) Oxygen consumption in H1299 cells transduced with lentiviruses encoding control or two independent MDM2 shRNAs. ETC CI-driven respiration, in the presence of glutamine, malate, and pyruvate (EIII GMP) as substrates, was measured by using a high-resolution Oxygraph respirometer (mean ± SEM; n = 3). (B) ETC CI-driven respiration (EIII GMP)in Mdm2flox/flox; p53−/− primary MEFs transduced with control (CTR) or CRE-expressing retroviruses (CRE) (mean ± SEM; n = four independent populations). (C) Enzymatic activities of the ETC complexes prepared from H1299 cells expressing control or MDM2 shRNAs. ETC CI, CII, and CIV activities were normalized to that of citrate synthase (CS) (mean ± SEM; n = 3). (D) ETC CI-driven respiration (EIII GMP) in H1299 cells expressing FL-MDM2 (FL), MTS-MDM2 (MTS), or MDM2 1-291 (1-291) and in control cells transfected with the corresponding empty vector (Empty) (mean ± SEM; n = 3). (E) ETC CI, CII, and CIV activities in H1299 cells expressing FL-MDM2 or MTS-MDM2. Complex activities were normalized to that of CS (mean ± SEM; n = 3). (F) MitoSOX staining of control (Empty) and H1299 cells expressing ectopic MTS-MDM2. (G) MitoSOX staining (red) of MCF-7 shp53 cells expressing CTR or MDM2 shRNAs. Nuclei are indicated in blue. Histobars in (F) and (G) represent the mean fluorescence intensity (MFI) per cell corresponding to the MitoSOX signal (mean ± SEM; n = 60 cells from three independent experiments). Scale bars, 10 μM. *p ≤ 0.05 and **p ≤ 0.01, indicating statistical significance of the observed differences. ns, not significant. See also Figure S4.
Figure 5.
Figure 5.. mtMDM2 Represses MT-ND6 Transcription
(A) Quantitative chromatin immunoprecipitation (qChIP) experiments showing the relative recruitment of mtMDM2 to the light strand promoter (LSP) in H1299 cells expressing MTS-MDM2 (MTS) or MDM2 1-291 (1-291), or in control cells transfected with the corresponding empty vector (Empty). Results were represented as the relative ratio between the mean value of immunoprecipitated chromatin (calculated as a percentage of the input) with an MDM2 polyclonal antibody (N20) and the one obtained with a control irrelevant antibody (mean ± SEM; n = 3). (B) qChIP analysis of endogenous MDM2 recruitment to the LSP in T47D transduced with lentiviruses expressing control of MDM2 shRNAs (mean ± SEM; n = 4). (C) qChIP analysis of TFAM recruitment to the LSP in the same cells as in (A) (mean ± SEM; n = 4). (D) Confocal microscopy analysis of TFAM (green) recruitment to the LSP (red) following the mTRIP procedure. Histobars represent the percentage of LSP/TFAM co-localization per cell (mean ± SEM; n = 45 cells from three independent experiments). (E) In vitro binding assay using purified recombinant MDM2 and a 1.6-kb biotinylated DNA probe of the mitochondrial genome encompassing the LSP and the HSP1. Left panel: AFM image showing MDM2 binding to the regulatory region of mtDNA (arrow). # indicates the biotinylated 5′ end of the probe used for orientation. Scale bar, 100 nm. Right panel: quantitative distribution of MDM2 binding along the mtDNA probe ora pUC18-derived DNA probe used as a control for non-specific binding (n = 200 DNA fibers). (F) Upper panel: Autoradiography of a representative in vitro mitochondrial transcription assay using a dual-promoter template performed in the presence of increasing concentrations of recombinant MDM2. Lower panel: histobars represent the quantification of LSP-driven transcription (mean ± SEM; n = 3). (G) RNA-FISH/mTRIP analysis of MT-ND6 RNA levels in H1299 cells expressing MTS-MDM2 or in CTR cells transfected with the empty vector (Empty). MT-ND6 probe is indicated in red; Hoechst is indicated in blue. Scale bars, 10 μM. Histobars represent the mean fluorescent intensity (MFI) per cell corresponding to MT-ND6 RNA (mean ± SEM; n = 45 cells from three independent experiments). (H) RNA-FISH/mTRIP analysis of MT-ND6 RNA levels in H1299 cells transduced with lentiviruses expressing control of MDM2 shRNAs. Scale bars, 10 μM (mean ± SEM; n = 45 cells from three independent experiments). (I) qRT-PCR analysis of MT-ND6 RNA levels in H1299 cells expressing control or MDM2 shRNAs (mean ± SEM; n = 3). (J) qRT-PCR analysis of the relative MT-ND6 RNA levels in MDM2-depleted H1299 cells upon transduction with a lentivirus encoding MTS-MDM2-C464A or a control empty virus (mean ± SEM; n = 3). (K and L) qIB of MDM2, MT-ND6, and TIM23 (loading control) protein levels in purified mitochondria (MITO) prepared (K) from H1299 cells expressing MTS-MDM2 or transfected with the corresponding empty vector and (L) from H1299 cells expressing control (sh Ctr) or two different MDM2 shRNAs. *p ≤ 0.05, **p ≤ 0.01, and ***p ≤ 0.001, indicating statistical significance of the observed differences. See also Figure S5.
Figure 6.
Figure 6.. mtMDM2 Represses MT-ND6 Expression and Mitochondrial Respiration during Hypoxia
(A) Top: representative IB analysis of endogenous total (TOTAL) or mitochondrial (MITO) MDM2, TUB, and TIM23 (loading controls) proteins in H1299 cells cultured in 21% or 1% O2 for 3 hr. Bottom: histobars represent the relative level of endogenous mtMDM2 determined by qIB (mean ± SEM; n = 5). (B) Co-immunoprecipitation assays showing increased association between endogenous MDM2 and mtHsp70/mortalin in H1299 cells cultured in 21% or 1% O2 for 3 or 24 hr. (C) qChIP experiments showing the relative recruitment of endogenous MDM2 (left) and TFAM (right) proteins to the LSP in H1299 cells cultured in 21% or 1% O2 for 3 hr (mean ± SEM; n = 3). (D) IB analysis of endogenous MDM2, MT-ND6, and TIM23 (loading control) protein levels in purified mitochondria prepared from H1299 cells expressing control (sh Ctr) or MDM2 (sh MDM2) shRNAs cultured in 21% O2 or 1% O2 for 3 hr. (E) Analysis of the mitochondrial network in H1299 cells expressing control (sh Ctr) or MDM2 (sh MDM2) shRNAs cultured in 21% O2 or 1% O2 for 24 hr. Left: microphotographs acquired by confocal microscopy after staining with anti-ATP5A (green) antibody and DAPI (blue). Arrows indicate perinuclear clustering of mitochondria. Scale bars, 10 μM. Right: histobars represent the percentage of cells exhibiting perinuclear clustering of mitochondria (mean ± SEM; n = 3). (F) MDM2, MT-ND6, and TIM23 (loading control) protein levels in purified mitochondria isolated from hindlimb muscles of WT C57BL/6 males housed in normoxic (21% O2) or mild hypoxic (15% O2) conditions for 3 hr. (G) qRT-PCR analysis of MT-ND6 RNA levels in hindlimb muscles of Mdm2CTR(ACTA); p53KO (CTR) and Mdm2KO(ACTA); p53KO (KO) animals housed in 15% O2 for 3 hr (mean ± SEM; n = 6 mice per group). (H) IB analysis of MT-ND6 and TIM23 (loading control) protein levels in purified mitochondria isolated from the hindlimbs of Mdm2 CTR and KO animals housed in 21% or 15% O2 for 3 hr. (I) ETC CI, CII, and CIV activities in the hindlimb muscles of Mdm2 CTR and KO animals housed in 15% O2 for 3hr. Enzymatic activities were normalized to that of CS (mean ± SEM; n = 6 mice per group). (J) Physical endurance of Mdm2 CTR and KO males was determined by forced treadmill running in a 21% or 15% O2 atmosphere. Histobars represent maximal aerobic velocity, expressed in meters per minute (mean ± SEM; n = 10 mice per group). *p ≤ 0.05, **p ≤ 0.01, and ***p ≤ 0.001, indicating statistical significance of the observed differences. ns, not significant. See also Figure S6.
Figure 7.
Figure 7.. mtMDM2 Increases Migration and Clonogenic Potential of Cancer Cells
(A) Clonogenic potential in anchorage-independent growth conditions of MDM2-depleted H1299 cells transduced with a lentivirus encoding a shRNA-MDM2-resistant version of MTS-MDM2-C464A (MTS) or with a control empty lentivirus (CTR). Left panel: clones were microphotographed 7 days after seeding a single-cell suspension. Scale bar, 500 μM. Right panel: histobars represent the number of clones per well after 7 days of culture (mean ± SEM; n = 3). (B) Single-cell tracking analysis of H1299 cells transduced with a lentivirus encoding MTS-MDM2-C464A (MTS) or with an empty lentivirus. Distance (in microns) to origin and the migratory path of ten representative cells for each population are indicated. (C and D) mtMDM2 increases invasion in anchorage-independent growth conditions. (C) Left: microphotographs of Transwell assays performed with MDM2-depleted H1299 cells transduced with a lentivirus encoding MTS-MDM2-C464A (MTS) or with an empty lentivirus. Right: histobars represent the number of living cells estimated by a colorimetric MTT (3-(4,5-dimethylthiazol-2-yl)-2,5-diphenyltetrazolium bromide) assay after 16 hr of culture (mean ± SEM; n = 3). (D) 3D tumor invasion assay. 20,000 MDM2-depleted H1299 cells transduced with a lentivirus encoding MTS-MDM2-C464A (MTS) or with an empty lentivirus (CTR) were seeded into ultra-low attachment plates. 24 hr later, the resulting spheroids were transferred in Matrigel-coated plates and microphotographed after 5 days in culture. Scale bars, 100 μM. Histobars represent the invasion area (histobars at left) or the total surface area (histobars at right) of the spheroids (mean ± SEM; n = 70 from three independent experiments). Double arrows indicate the width of the invasion ring. (E) qRT-PCR analysis of EPHA2, ZEB1, and ZEB2 mRNA levels in MDM2-depleted H1299 cells transduced with a lentivirus encoding MTS-MDM2-C464A(MTS), or with a control empty lentivirus, after 5 days of culture (mean ± SEM; n = 3). (F) Schematic representation of mtMDM2 activities in normal muscle and cancer cells. Oxidative stress and hypoxia induce MDM2 localization to mitochondria to repress LSP-driven MT-ND6 transcription, leading to decreased respiration. *p ≤ 0.05, **p ≤ 0.01, and ***p ≤ 0.001 indicate statistical significance of the observed differences. ns = not significant. See also Figure S7.

References

    1. Ahn BY, Trinh DLN, Zajchowski LD, Lee B, Elwi AN, and Kim SW (2010). Tid1 is a new regulator of p53 mitochondrial translocation and apoptosis in cancer. Oncogene 29, 1155–1166. - PubMed
    1. Al-Mehdi AB, Pastukh VM, Swiger BM, Reed DJ, Patel MR, Bardwell GC, Pastukh VV, Alexeyev MF, and Gillespie MN (2012). Perinuclear mitochondrial clustering creates an oxidant-rich nuclear domain required for hypoxia-induced transcription. Sci. Signal. 5, ra47. - PMC - PubMed
    1. Arnold JJ, Bernal A, Uche U, Sterner DE, Butt TR, Cameron CE, and Mattern MR (2006). Small ubiquitin-like modifying protein isopeptidase assay based on poliovirus RNA polymerase activity. Anal. Biochem. 350, 214–221. - PMC - PubMed
    1. Bergeaud M, Mathieu L, Guillaume A, Moll U, Mignotte B, Le Floch N, Vayssière J-L, and Rincheval V (2014). Mitochondrial p53 mediates a transcription-independent regulation of cell respiration and interacts with the mitochondrial F1F0-ATP synthase. Cell Cycle 12, 2781–2793. - PMC - PubMed
    1. Biderman L, Manley JL, and Prives C (2012). Mdm2 and MdmX as regulators of gene expression. Genes Cancer 3, 264–273. - PMC - PubMed

Publication types

MeSH terms

Substances