. 2018 Sep:178:751-766.
doi: 10.1016/j.biomaterials.2018.01.032. Epub 2018 Feb 13.

Photo-immobilized EGF chemical gradients differentially impact breast cancer cell invasion and drug response in defined 3D hydrogels

Affiliations

Photo-immobilized EGF chemical gradients differentially impact breast cancer cell invasion and drug response in defined 3D hydrogels

Stephanie A Fisher et al. Biomaterials. 2018 Sep.

Abstract

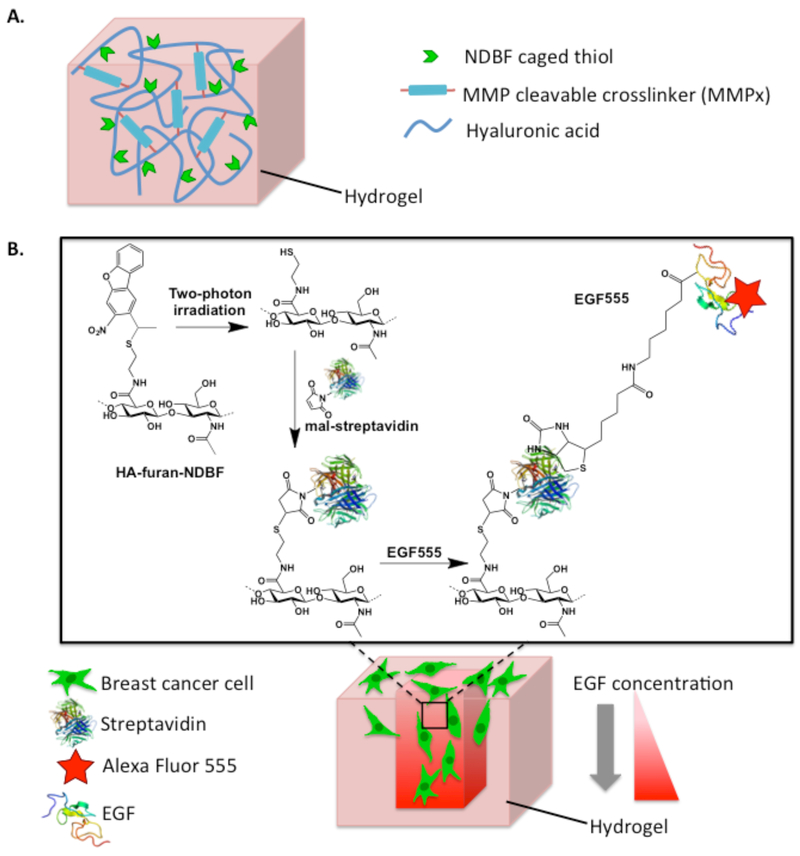
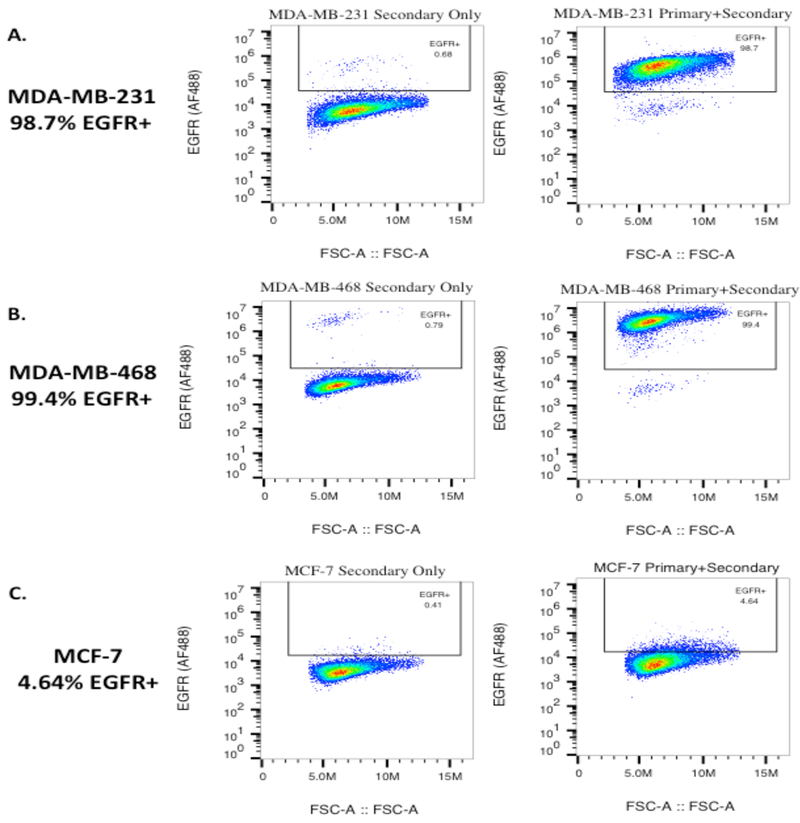
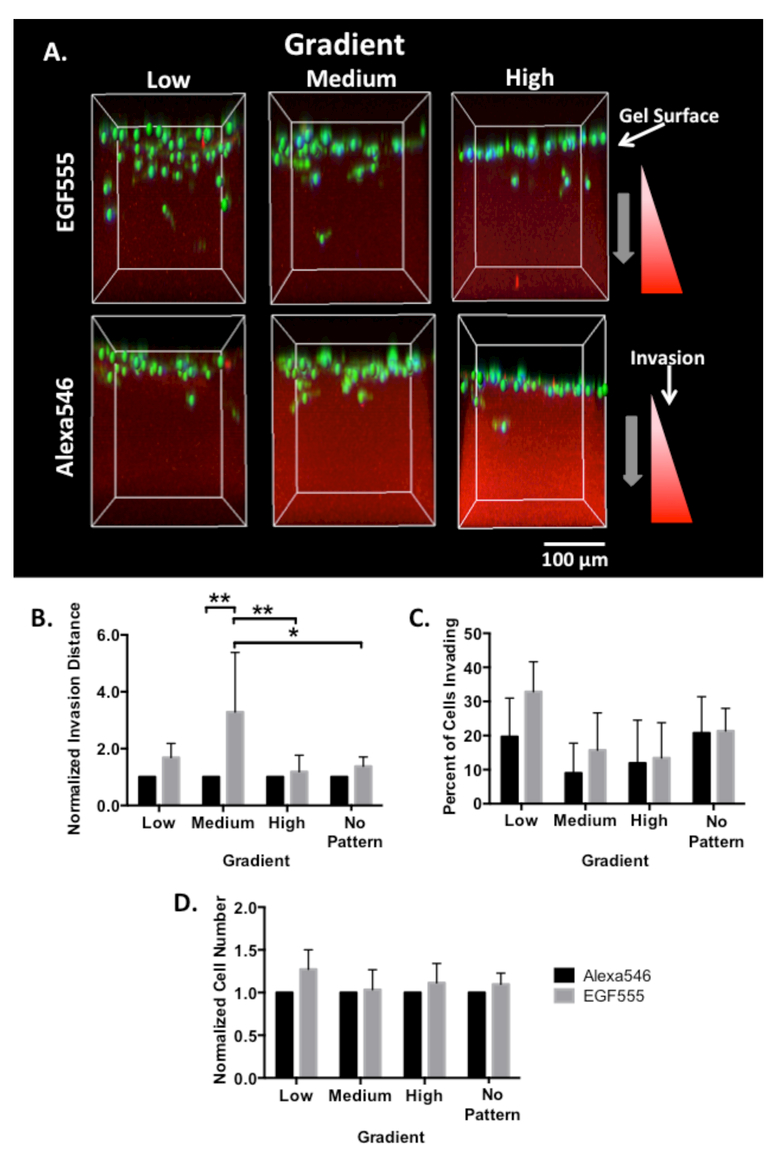
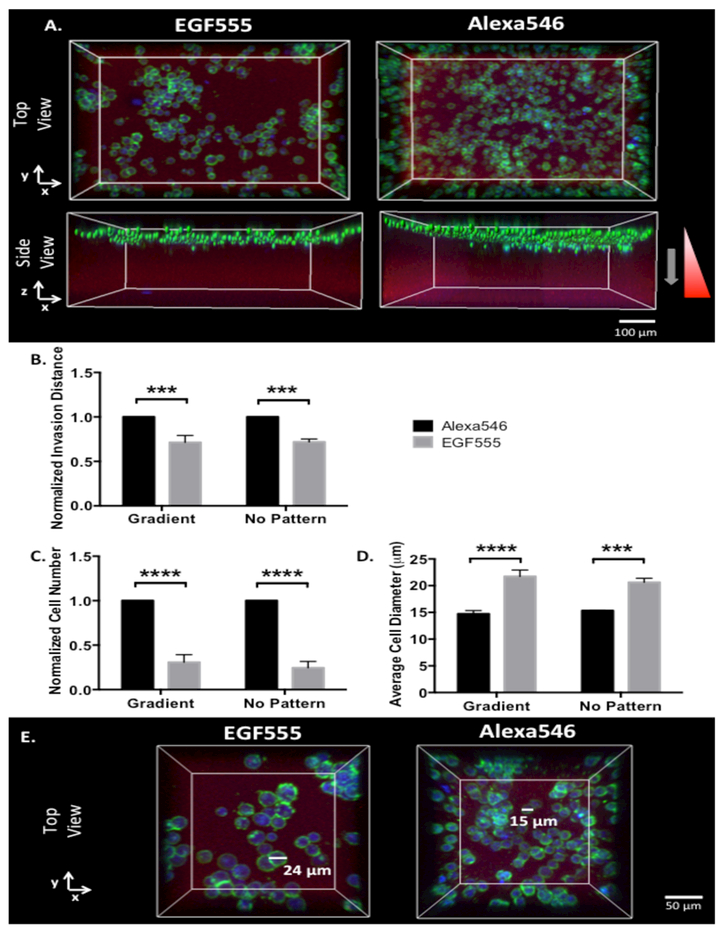
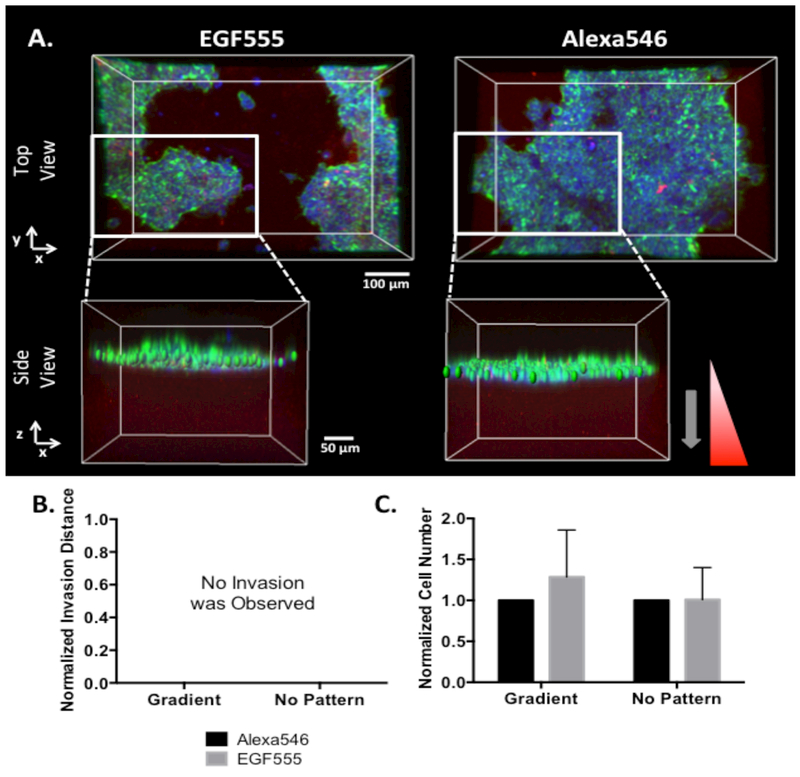
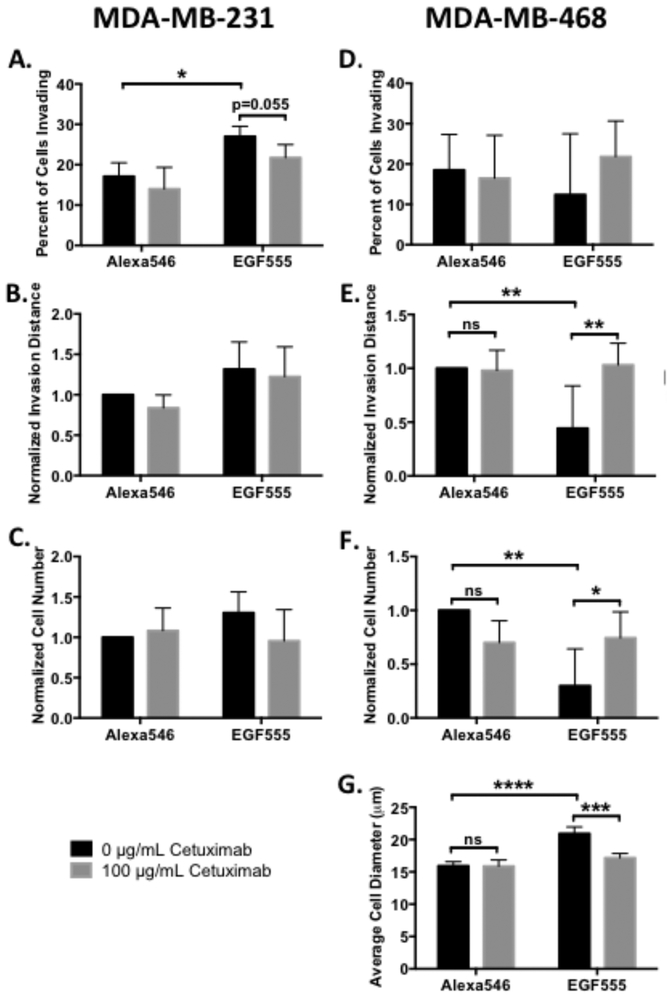
Breast cancer cell invasion is influenced by growth factor concentration gradients in the tumor microenvironment. However, studying the influence of growth factor gradients on breast cancer cell invasion is challenging due to both the complexities of in vivo models and the difficulties in recapitulating the tumor microenvironment with defined gradients using in vitro models. A defined hyaluronic acid (HA)-based hydrogel crosslinked with matrix metalloproteinase (MMP) cleavable peptides and modified with multiphoton labile nitrodibenzofuran (NDBF) was synthesized to photochemically immobilize epidermal growth factor (EGF) gradients. We demonstrate that EGF gradients can differentially influence breast cancer cell invasion and drug response in cell lines with different EGF receptor (EGFR) expression levels. Photopatterned EGF gradients increase the invasion of moderate EGFR expressing MDA-MB-231 cells, reduce invasion of high EGFR expressing MDA-MB-468 cells, and have no effect on invasion of low EGFR-expressing MCF-7 cells. We evaluate MDA-MB-231 and MDA-MB-468 cell response to the clinically tested EGFR inhibitor, cetuximab. Interestingly, the cellular response to cetuximab is completely different on the EGF gradient hydrogels: cetuximab decreases MDA-MB-231 cell invasion but increases MDA-MB-468 cell invasion and cell number, thus demonstrating the importance of including cell-microenvironment interactions when evaluating drug targets.

Keywords: Breast cancer; EGF; Gradients; Hydrogels; Invasion.


Figures

Figure 1.
Figure 1.
A) Furan modified hyaluronic acid (HA) is crosslinked with bis-maleimide, MMP cleavable peptide crosslinkers (MMPx) to form a hydrogel through a Diels-Alder Click reaction. The HA hydrogel backbone is also modified with nitrodibenzofuran (NDBF) caged thiols (HANDBF), which participate in the photopatterning reaction. B) Schematic diagram depicting photopatterning of HANDBF/MMPx hydrogels and subsequent breast cancer cell invasion. Two-photon irradiation of NDBF uncages a reactive thiol, with the concentration of the free thiol proportional to the number of two-photon scans. The free thiol then reacts with maleimide-streptavidin (mal-streptavidin), forming immobilized streptavidin patterns. Biotinylated EGF, modified with Alexa Fluor 555 for visualization (EGF555), binds to the immobilized streptavidin to create EGF gradients. Streptavidin structure obtained from Baugh et al. through the Protein Data Bank). [34]
Figure 2.
Figure 2.
Two-photon patterning of mal-546 using A) NDBF-, B) mBhc-, and C) Bhc- caged thiols in HA/PEG hydrogels. Regions of interest were scanned 10 to 50 times at a fixed z-dimension in HANDBF//PEG, HABhc//PEG, and HAmBhc/PEG hydrogels. Confocal images of the x-y planes are shown along with the z-axis profile of the mal-546 square patterns with the maximum intensity centred at 0 μm. Background mal-546 concentration was subtracted from the immobilized mal-546 concentration. The concentrations of NDBF, Bhc, and mBhc were matched based on 1H NMR substitution. The bar above the tiles was scanned 50 times to verify that the laser power was constant across the x-axis.
Figure 3.
Figure 3.
A) Confocal image of mal-546 gradients in HANDBF/PEG with scanning intervals either 20 or 5 μm apart in the z-axis. Gradients were formed using a scan speed of 0.009 μm μs−1. Confocal images were enhanced for visualization. B) Quantification of mal-546 gradients in HANDBF/PEG with scanning intervals either 20 or 5 μm apart in the z-axis. Background mal-546 concentration was subtracted from the immobilized mal-546 concentration. C) Quantification of low, medium, and high (0.7242, 0.8624, and 1.2074 ng mL−1 μm−1, respectively) EGF555 gradients in HANDBF/MMPx hydrogels created at scan speeds of 0.527, 0.263, and 0.132 μm μs−1, respectively. At the surface of the hydrogel (0 μm) the hydrogel was scanned one time. The scan number was increased by one scan every 5 μm interval going into the hydrogel until a gradient of 150 μm in depth was formed. The amount of EGF555 in the non-patterned regions of the hydrogel was also quantified (0.1581 ng mL−1 μm−1). Slopes were found to be significantly different (****p<0.0001). Error bars displayed as SEM, n=4. D) Confocal images of low, medium, and high EGF555 gradients in HANDBF/MMPx hydrogels.
Figure 4.
Figure 4.
Flow cytometry analysis of the expression of EGFR on: A) MDA-MB-231, B) MDA-MB-468, and C) MCF-7 breast cancer cell lines. The majority of the MDA-MB-231 and MDA-MB-468 cell populations were positive for EGFR (98.7% and 99.4%, respectively), with MDA-MB-468 cells having a greater EGFR staining intensity. MCF-7 cells were found to express EGFR in 4.64% of the population. The forward scatter is displayed on the x-axis.
Figure 5.
Figure 5.
A) Confocal reconstruction of MDA-MB-231 cells invading into HANDBF/MMPx hydrogels with low, medium, and high gradients of EGF555 and Alexa546. B) Normalized invasion distance of MDA-MB-231 cells in low, medium, and high gradients of Alexa546 and EGF555 and non-patterned regions of the HANDBF/MMPx hydrogel (day 6, n=5, mean + standard deviation). EGF555 significantly increased invasion compared to the control Alexa546 gradients (**p<0.01, two-way ANOVA). The slope of the gradient also significantly affected invasion (*p<0.05). Post hoc comparisons are shown graphically. C) Percent of invading MDA-MB-231 cells in low, medium, and high gradients of Alexa546 and EGF555. (day 6, n=5, mean + standard deviation). D) Normalized cell number of MDA-MB-231 cells in low, medium, and high gradients of Alexa546 and EGF555 and non-patterned regions of the HANDBF/MMPx hydrogel (day 6, n=5, mean + standard deviation).
Figure 6.
Figure 6.
A) Confocal reconstruction of MDA-MB-468 cells invading into HANDBF/MMPx hydrogels with medium gradients of EGF555 and Alexa546 B) Normalized invasion distance of MDA-MB-468 cells in medium gradients of Alexa546 and EGF555 and non-patterned regions of the HANDBF/MMPx hydrogel (day 6, n=3, mean + standard deviation). EGF555 significantly decreased MDA-MB-468 invasion distance compared to Alexa546 on both the gradient and non-patterned regions (****p<0.0001, two-way ANOVA). C) Normalized cell number of MDA-MB-468 cells in medium gradients of Alexa546 and EGF555 and non-patterned regions of the HANDBF/MMPx hydrogel (day 6, n=3, mean + standard deviation). EGF555 significantly decreased MDA-MB-468 cell number compared to Alexa546 on both the gradient and non-patterned regions (****p<0.0001, two-way ANOVA). D) Average cell diameter of MDA-MB-468 cells in medium gradients of Alexa546 and EGF555 and non-patterned regions of the HANDBF/MMPx hydrogel (day 6, n=3, mean + standard deviation). EGF555 significantly increased MDA-MB-468 cell diameter compared to Alexa546 on both the gradient and non-patterned regions (***p<0.001, two-way ANOVA). E) Representative images showing MDA-MB-468 cells with larger diameters when cultured on EGF555 gradients compared to the control Alexa546 gradients.
Figure 7.
Figure 7.
A) Confocal reconstruction of MCF-7 cells cultured on HANDBF/MMPx hydrogels with medium gradients of EGF555 and Alexa546. Side views are zoomed in on a portion of the gradient so the MCF-7 cells can be clearly visualized as a cluster on the surface of the hydrogel. B) MCF-7 cells failed to invade into medium Alexa546 and EGF555 gradients after 6 days of culture (n=6). C) Normalized cell number of MCF-7 cells in medium gradients of Alexa546 and EGF555 and non-patterned regions of the HANDBF/MMPx hydrogel (day 6, n=6, mean + standard deviation). EGF555 had no significant influence on MCF-7 cell number (two-way ANOVA).
Figure 8.
Figure 8.
Cetuximab differentially affects MDA-MB-231 and MDA-MB-468 cell invasion and cell number. Post hoc comparisons are depicted graphically. A) Percent of invading MDA-MB-231 cells in low concentration gradient HANBDF/MMPx hydrogels of Alexa546 or EGF555 treated with either 0 or 100 μg mL−1 of cetuximab (day 3, n=4, mean + standard deviation). EGF555 significantly increased the percent of MDA-MB-231 cells invading into the gradients relative to Alexa546 gradients (***p<0.001, two-way ANOVA), while cetuximab significantly decreased the percent of invading MDA-MB-231 cells relative to no treatment (*p<0.05, two-way ANOVA). B) Normalized invasion distance of MDA-MB-231 cells on low gradients of Alexa546 or EGF555 treated with either 0 or 100 μg mL−1 of cetuximab (day 3, n=4, mean + standard deviation). C) Normalized cell number of MDA-MB-231 cells were similar on low gradients of Alexa546 or EGF555 treated with either 0 or 100 μg mL−1 of cetuximab (day 3, n=4, mean + standard deviation). D) Percent of invading MDA-MB-468 cells in low concentration gradient HANBDF/MMPx hydrogels of Alexa546 or EGF555 treated with either 0 or 100 μg mL−1 of cetuximab (day 6, n=5, mean + standard deviation). E) Normalized invasion distance of MDA-MB-468 cells on low gradients of Alexa546 or EGF555 treated with either 0 or 100 μg/mL of cetuximab (day 6, n=5, mean + standard deviation). Cetuximab treatment increased MDA-MB-468 cell invasion relative to no treatment (*p<0.05, two-way ANOVA). F) Normalized cell number of MDA-MB-468 cells on low gradients of Alexa546 or EGF555 treated with either 0 or 100 μg/mL of cetuximab (day 6, n=5, mean + standard deviation). Cetuximab treatment increased MDA-MB-468 cell number relative to no treatment (**p<0.01, two-way ANOVA). G) Average MDA-MB-468 cell diameter on low gradients of Alexa546 or EGF555 treated with either 0 or 100 μg/mL of cetuximab (day 6, n=4, mean + standard deviation). Cetuximab treatment decreased MDA-MB-468 cell diameter relative to no treatment (***p<0.001, two-way ANOVA).

Similar articles

Cited by

References

    1. Lu P, Weaver VM, Werb Z, The extracellular matrix: A dynamic niche in cancer progression, The Journal of Cell Biology. 196 (2012) 395–406. doi:10.1083/jcb.201102147. - DOI - PMC - PubMed
    1. Wei SC, Fattet L, Tsai JH, Guo Y, Pai VH, Majeski HE, et al., Matrix stiffness drives epithelial-mesenchymal transition and tumour metastasis through a TWIST1-G3BP2 mechanotransduction pathway, Nature Cell Biology. 17 (2015) 678–688. doi:10.1038/ncb3157. - DOI - PMC - PubMed
    1. Mao Y, Keller ET, Garfield DH, Shen K, Wang J, Stromal cells in tumor microenvironment and breast cancer, Cancer Metastasis Rev. 32 (2013) 303–315. doi:10.1007/s10555-012-9415-3. - DOI - PMC - PubMed
    1. Muller A, Homey B, Soto H, Ge N, Catron D, Buchanan ME, et al., Involvement of chemokine receptors in breast cancer metastasis, Nature. 410 (2001) 50–56. - PubMed
    1. Infanger DW, Lynch ME, Fischbach C, Engineered Culture Models for Studies of Tumor-Microenvironment Interactions, Annu. Rev. Biomed. Eng 15 (2013) 29–53. doi :10.1146/annurev-bioeng-071811-150028. - DOI - PMC - PubMed

Publication types