. 2018 Mar 21;38(12):3124-3146.
doi: 10.1523/JNEUROSCI.0188-17.2018. Epub 2018 Feb 16.

Hippocampal Ripple Oscillations and Inhibition-First Network Models: Frequency Dynamics and Response to GABA Modulators

Affiliations

Hippocampal Ripple Oscillations and Inhibition-First Network Models: Frequency Dynamics and Response to GABA Modulators

José R Donoso et al. J Neurosci. .

Abstract

Hippocampal ripples are involved in memory consolidation, but the mechanisms underlying their generation remain unclear. Models relying on interneuron networks in the CA1 region disagree on the predominant source of excitation to interneurons: either "direct," via the Schaffer collaterals that provide feedforward input from CA3 to CA1, or "indirect," via the local pyramidal cells in CA1, which are embedded in a recurrent excitatory-inhibitory network. Here, we used physiologically constrained computational models of basket-cell networks to investigate how they respond to different conditions of transient, noisy excitation. We found that direct excitation of interneurons could evoke ripples (140-220 Hz) that exhibited intraripple frequency accommodation and were frequency-insensitive to GABA modulators, as previously shown in in vitro experiments. In addition, the indirect excitation of the basket-cell network enabled the expression of intraripple frequency accommodation in the fast-gamma range (90-140 Hz), as in vivo In our model, intraripple frequency accommodation results from a hysteresis phenomenon in which the frequency responds differentially to the rising and descending phases of the transient excitation. Such a phenomenon predicts a maximum oscillation frequency occurring several milliseconds before the peak of excitation. We confirmed this prediction for ripples in brain slices from male mice. These results suggest that ripple and fast-gamma episodes are produced by the same interneuron network that is recruited via different excitatory input pathways, which could be supported by the previously reported intralaminar connectivity bias between basket cells and functionally distinct subpopulations of pyramidal cells in CA1. Together, our findings unify competing inhibition-first models of rhythm generation in the hippocampus.SIGNIFICANCE STATEMENT The hippocampus is a part of the brain of humans and other mammals that is critical for the acquisition and consolidation of memories. During deep sleep and resting periods, the hippocampus generates high-frequency (∼200 Hz) oscillations called ripples, which are important for memory consolidation. The mechanisms underlying ripple generation are not well understood. A prominent hypothesis holds that the ripples are generated by local recurrent networks of inhibitory neurons. Using computational models and experiments in brain slices from rodents, we show that the dynamics of interneuron networks clarify several previously unexplained characteristics of ripple oscillations, which advances our understanding of hippocampus-dependent memory consolidation.

Keywords: CA1; basket cells; fast gamma; memory consolidation; network oscillations; sharp wave/ripple complexes.


Figures

Figure 1.
Figure 1.
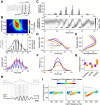
Steady-state oscillations in a model of the CA1 BC network. A, Network activity at an input rate of 3000 spikes/s. Oscillations in the population rate (top) emerge from units that fire irregularly (middle: spike raster plot for 20 of 200 units). Bottom, Membrane potential of a unit (spike times: middle, horizontal gray bar). Subthreshold oscillations are superimposed on random fluctuations. B, Power spectral density of population activity (top) and firing-rate histogram of units (bottom) at four levels of input rates (gray corresponds to activity depicted in A). C, Network activity at an input rate of 9000 spikes/s (B, green). Oscillations in the population rate (top) emerge from units that fire regularly and rarely skip cycles of the population activity (middle). Bottom, Membrane potential of a unit (spike times: middle, gray bar). D, Steady-state network response as a function of input strength (input levels depicted in B are indicated by colored triangles below the horizontal axis). Top, Network frequency (triangles) and mean firing rate of units (circles). Gray area represents the ripple band (140–220 Hz). Middle, The saturation (triangles) is the average fraction of units recruited in one cycle. Irregularity of firing is described by the average CV (circles) of the interspike interval of units. Bottom, Coherence of network oscillations. Error bars are smaller than marker size. E, Sequence of three input levels (top), spike-time histogram of network activity (middle; bin width 0.5 ms), and membrane-potential distribution across the interneuron population (bottom). At an input rate of 3000 spikes/s (t < 0 ms), the distribution of membrane potentials exhibits a subthreshold sinusoidal mean. The tail of the distribution reaches the threshold (dashed line; see also A, bottom). At 6000 spikes/s (0 < t < 20 ms), ∼75% of the population is recruited (middle) in every cycle. Because the network is close to saturation, a further increase to 12,000 spikes/s (t ≥ 20 ms) reduces the time between bursts of activity (middle). The threshold is then reached in the rising (excitatory) phase of the membrane potentials.
Figure 2.
Figure 2.
Network response to changing input rate is asymmetric. A, A double ramp input rate (top, gray) consists of a linear increase (t < 0 ms), a plateau (0 ≤ t < 40 ms), and a linear decrease (t ≥ 40 ms). The network response (top, black) is asymmetric with respect to the input. The membrane-potential distribution (bottom) shows that the network is in a high-noise state (bottom, t ≤ −20 ms) and synchronizes in the middle of the ascending input ramp at t ≈ −20 ms. The network then remains in a low-noise state during the plateau and the entire descending phase (bottom, 40 < t ≤ 75 ms). B, Time courses of input (top), average frequency responses (middle), and average saturations (bottom) for different parameters of the double ramp. During the ascending phase (solid line), the onset frequency (∼220 Hz) is independent of the amplitude (B1), slope (B2), and combinations of these two parameters (B3), regardless of its steady-state value (dotted line). Frequency decays with input during the descending phase (dashed line). C, Frequency (top) and saturation (bottom) as a function of input rate (obtained from B). Frequency is more sensitive to input on the descending phase (top, dashed line), which is consistent with the respective higher saturation (bottom, dashed line). Each average trace was obtained from 50 simulations. Error bars (data not shown) were comparable with the line width. B2, B3, Black traces are respectively identical.
Figure 3.
Figure 3.
Interneuron-network response to excitatory bursts from CA3. A, Interneurons (black circles) are randomly interconnected with probability pc = 0.2. The driving population is randomly connected to the interneuron network with probability pshare = 0.095. Excitatory fibers (gray lines, only 6 shown) from the bursting subpopulation (1400 units) fire once with a normally distributed timing. The remaining 6800 fibers fire randomly and provide a total background rate of 1200 spikes/s to each interneuron. B, Top, Wavelet spectrogram and instantaneous peak frequency (white) of the transient response (middle, black). The transient response exhibits IFA. Middle, Overlay of the total input activity (gray, input rate) and response of the interneuronal network (black, output rate). The network responds with a modulated oscillation whose envelope lags the input burst. Bottom, Mean synaptic currents across the population generated by the excitatory input (red) and the inhibitory recurrent response (blue). On the ascending phase of the input, inhibitory peaks remain slightly below the ongoing excitatory current. The opposite occurs during the descending phase. C, Spike-time histogram (top) and time course of membrane-potential distribution (bottom). During an initial stage (t ≲ −5 ms), a wider distribution of membrane potentials shows subthreshold oscillations that increase in amplitude, denoting an unsaturated (high noise) state. This initial stage is followed by a saturated (low noise) state (t ≳ 0 ms). D, Average IFA signatures obtained at different burst widths σ. Black represents control value σ = 7 ms, used also in B and C. Broader input bursts (σ = 10 ms, orange) evoke shallower IFA signatures, whereas narrower input bursts (σ = 5 ms, violet) evoke sharper IFA signatures (see also Fig. 2B3). E, Average power spectra obtained for the same burst widths as in D. Broader input bursts evoke slower ripples. F, Average time course of power obtained for the same burst widths as in D. Broader input bursts evoke longer lasting but weaker transient responses. G, Changes in frequency, firing rate (FR), and duration with respect to the control value σ = 7 ms. B–G, Average traces were obtained from 20 simulations. H, In a ripple-modulated CA3 burst (gray), spikes (dots) are phase-locked (vector strength vs = 0.2) to a local rhythm (180 Hz, vertical dashed lines at input-rate peaks). The CA1 LFP response (black; see Materials and Methods) oscillates at 200 Hz, and CA3 spikes are weakly coupled to the CA1 LFP (vs = 0.08). I, CA1 frequency as a function of CA3 frequency for different CA3 modulation depths. Colored dots represent simulated events; CA3 vector strength vs = 0.1 (left), 0.2 (middle), and 0.4 (right). At vs = 0.1 and 0.2, CA1 oscillates at its intrinsic frequency (∼200 Hz), almost independently of the CA3 frequency (dashed line indicates identity). The coupling of the CA3 spikes to the CA1 LFP becomes prominent when CA3 frequencies are close to the CA1 intrinsic frequency (∼200 Hz). At vs = 0.4 (right), the CA3 ripple affects the CA1 frequency at a wider range. The coupling of CA3 spikes to the CA1 ripples (vector strength, color coded) is normalized to the vector strength of the input, individually for each CA3 modulation depth.
Figure 4.
Figure 4.
Induced oscillations under two driving conditions. A, A population of pyramids (pyr; gray triangles, 12,000 units) is reciprocally interconnected with an interneuron network (int; black circles, 200 units; connection probabilities pc: pyr → int = 0.1, int → pyr = 0.3, pyr → pyr = 0.01). During indirect drive, a subpopulation of 100 pyramids is excited with Gaussian bursts (green, σ = 13 ms). Burst amplitudes were normally distributed across neurons (green: mean; dashed line, ±SD). Two input levels (30 nS and 60 nS) are shown. B, Network response to indirect-drive for the two input levels depicted in A (green, left and right, respectively). B1, Top, Wavelet spectrogram and instantaneous peak frequency (white) of the interneuron population activity (bottom, black). At low input (30 nS, left), the transient response exhibits IFA at ∼130 Hz. At high input (60 nS, right), the frequency peaks at ∼155 Hz and there is no IFA. Bottom, Overlay of the activities of the pyramidal (gray) and interneuronal (black) populations. Pyramids lead interneurons. B2, Synaptic conductances across the interneuron population. C, The isolated interneuron network (black circles) is directly driven with normally distributed Gaussian bursts (red). Burst profiles and variability were adjusted to resemble the filtered (<30 Hz) excitatory conductances shown in B2 (left and right, light red), yielding profiles with σ = 14 ms and average peaks: 7 nS and 12 nS, respectively. D, Same as B when the interneuron network is directly excited with the profiles depicted in C. The network response displays the stereotypical IFA shape at ∼172 Hz (left) and ∼186 Hz (right). The directly driven interneuronal network requires comparably lower excitation to generate oscillations in the ripple band.
Figure 5.
Figure 5.
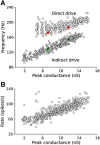
Network-frequency response for indirect versus direct drive of interneurons. A, Network frequency as a function of the peak input conductance to interneurons. For indirect drive (triangles, 280 simulations), the network frequency increased linearly with peak conductance, covering the fast-gamma range (90–140 Hz) and part of the lower ripple band (range, 93–172 Hz). For direct drive (circles, 240 simulations), frequency was limited to the ripple band (range, 162–225 Hz). B, Firing rate of interneurons as a function of the peak input conductance to interneurons. Units expressed similar firing rates in both direct (open circles) and indirect (open triangles) conditions. Green triangles and red circles correspond to the examples shown in Figure 4B and Figure 4D, respectively.
Figure 6.
Figure 6.
Inhibitory and excitatory currents in pairs of CA1 pyramidal cells during SWRs in vitro. A, To isolate inhibitory currents, two cells were clamped at 6 mV. Top (black), Extracellular SWR. Bottom, Simultaneously recorded inhibitory currents (gray) and bandpass filtered versions (as indicated, blue). B, Magnification and overlay of the two filtered currents and their envelopes as derived from the Hilbert transform (top). The instantaneous phase shift (bottom, gray) between the two ripple oscillations was obtained by subtracting the angles yielded by their respective Hilbert transforms. The average phase shift (−4 degrees) and the quality of phase locking (vector strength 0.99) were estimated from the time span where both envelopes exceed 3 SD of baseline (gray box). C, Average phase shifts and vector strengths of inhibitory currents for 124 SWR events (gray circles) recorded in one cell pair. Black circle represents the average phase vector (phase shift: −32 degrees; vector strength: 0.81) across events. D, Average phase vectors for 7 cell pairs (symbols). E, To isolate excitatory currents, two cells were clamped at −55 mV. Top (black), Extracellular SWR. Bottom, Simultaneously recorded excitatory currents (gray) and low-pass filtered versions (as indicated, red). F, Overlay of the two filtered and rectified currents (top), their temporal derivatives (middle), and the cross-correlation of the derivatives (bottom). The maximum of the cross-correlation (0.97) indicates the strength of the correlation, and the time of this peak (0.7 ms) denotes the time lag of the two excitatory inputs for a particular SWR. G, Time lags as a function of the maximum correlation (top, gray dots) and histogram of maximum correlations (bottom) for 191 events (gray dots) recorded in one cell pair. Black circle represents the average correlation (0.79 ± 0.01) and the average time lag (0.9 ± 0.5 ms) across events. H, Average time lag versus average correlation for 7 cell pairs. The grand average time lag (across cell pairs) was −0.04 ± 0.54 ms (range, −2.9 to 1.4 ms).
Figure 7.
Figure 7.
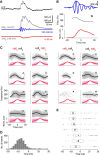
IFA and its relation to the time course of excitation in CA1 pyramidal cells in vitro. A, During an SWR in the LFP (top), the inhibitory current was recorded in cell 1 (middle), whereas the excitatory current was simultaneously recorded in cell 2 (bottom). B, Illustration of the analysis of a single event. From the inhibitory ripple current obtained from cell 1 (blue, top), the instantaneous frequency (middle) was calculated from its wavelet spectrogram. The instantaneous-frequency trace (middle, gray) is plotted only for the time interval where the envelope of the ripple oscillation exceeds 3 SD of the baseline (here from −6 to 20 ms). The simultaneously recorded, low-pass filtered signal that represents excitation (red, bottom) has a peak at a time at which the instantaneous frequency is decreasing. Here, the time is set relative to the peak of the excitatory input current (t = 0). C, Instantaneous ripple frequencies and time courses of excitatory currents for 7 cell pairs (symbols at top right corners matched to Fig. 6). For all but one cell pair, we recorded in two conditions by switching the holding potentials (6 and −55 mV) of the two cells. Each subplot shows an overlay of instantaneous frequencies (gray) and normalized excitatory currents (pink) for all SWR events recorded in one recording condition for a cell pair. The average instantaneous frequency (black) is calculated only at times where at least 10 traces overlap. Red represents average excitatory currents. In 6 (of 7) cell pairs, the average instantaneous ripple frequency has a peak before the mean excitation reaches its maximum. D, Time of frequency peak for 1972 events recorded from 7 pairs. On average, the instantaneous ripple frequency has a peak 6.2 ± 0.2 ms before the mean excitation reaches its maximum. E, Time of frequency peak for all events recorded in each cell pair. Symbols represent the mean and identify the cell pair. Average time across cells pairs: −5.3 ± 0.9 ms (range, −8.0 to −2.0 ms).
Figure 8.
Figure 8.
Simulation of the effect of three different GABA modulators: 1, Uptake-blocker NNC711; 2, thiopental; and 3, zolpidem. A, Left, Average IFA signatures obtained for control (black, identical to Fig. 3D) and under the effect of the drug (orange). Insets, The action of the drug on the inhibitory postsynaptic conductance. Right, Normalized average power spectra of network activity for control (black) and during exposure to the drug (orange). B, Average time courses of ripple power of network activity for control (black) and during exposure to the drug (orange). C, Examples of simulated ripple extracellular potentials obtained from the average inhibitory current across the population (see Materials and Methods). D, Changes in frequency, firing rate (FR), and duration with respect to control values. Each average trace was obtained from 20 simulations.
Figure 9.
Figure 9.
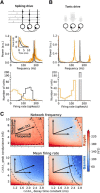
Differential effects of GABAA parameters on network response for spiking and tonic drives. A, Network driven by uncorrelated spiking activity (top). Normalized power spectral densities (middle) and firing-rate histograms (bottom) for the control condition (black) and for the simulated application of the GABA-uptake blocker NNC-711 (orange). Under the effect of the drug on the postsynaptic conductance (inset), the network peak frequency is almost unaffected, but the distribution of firing rates is shifted to lower values. B, Network driven by tonic conductances (top). Tonic conductances (gray arrows) were distributed across the population with low variability (CV = 0.03). Under the action of the drug (A, inset), both the peak frequency and the firing rates are shifted to lower values. C, Dependence of network peak frequency (top) and mean firing rate (bottom) on GABAA decay-time constant and peak conductance for spiking drive (left column) and tonic drive (right column). Black arrows indicate the changes in GABAA parameters induced by different drugs. For spiking drive (left), the peak frequency remains relatively insensitive to changes in GABAA kinetics, whereas the mean firing rate is strongly affected. For tonic drive (right), both peak frequency and mean firing rate are rather sensitive to GABAA parameters. Solid, dashed, and dotted lines outline different levels of coherence (top) and CV of firing rate (bottom).

Comment in

Similar articles

Cited by

References

    1. Aika Y, Ren JQ, Kosaka K, Kosaka T (1994) Quantitative analysis of GABA-like-immunoreactive and parvalbumin-containing neurons in the CA1 region of the rat hippocampus using a stereological method, the disector. Exp Brain Res 99:267–276. - PubMed
    1. Axmacher N, Elger CE, Fell J (2008) Ripples in the medial temporal lobe are relevant for human memory consolidation. Brain 131:1806–1817. 10.1093/brain/awn103 - DOI - PubMed
    1. Bähner F, Weiss EK, Birke G, Maier N, Schmitz D, Rudolph U, Frotscher M, Traub RD, Both M, Draguhn A (2011) Cellular correlate of assembly formation in oscillating hippocampal networks in vitro. Proc Natl Acad Sci U S A 108:E607–E616. 10.1073/pnas.1103546108 - DOI - PMC - PubMed
    1. Bartos M, Vida I, Frotscher M, Meyer A, Monyer H, Geiger JR, Jonas P (2002) Fast synaptic inhibition promotes synchronized gamma oscillations in hippocampal interneuron networks. Proc Natl Acad Sci U S A 99:13222–13227. 10.1073/pnas.192233099 - DOI - PMC - PubMed
    1. Bazelot M, Teleńczuk MT, Miles R (2016) Single CA3 pyramidal cells trigger sharp waves in vitro by exciting interneurones. J Physiol 594:2565–2577. 10.1113/JP271644 - DOI - PMC - PubMed

Publication types

Substances

LinkOut - more resources