. 2018 Feb 16;8(1):3213.
doi: 10.1038/s41598-018-21426-6.

p66Shc Signaling Mediates Diabetes-Related Cognitive Decline

Affiliations

p66Shc Signaling Mediates Diabetes-Related Cognitive Decline

Yohei Minami et al. Sci Rep. .

Abstract

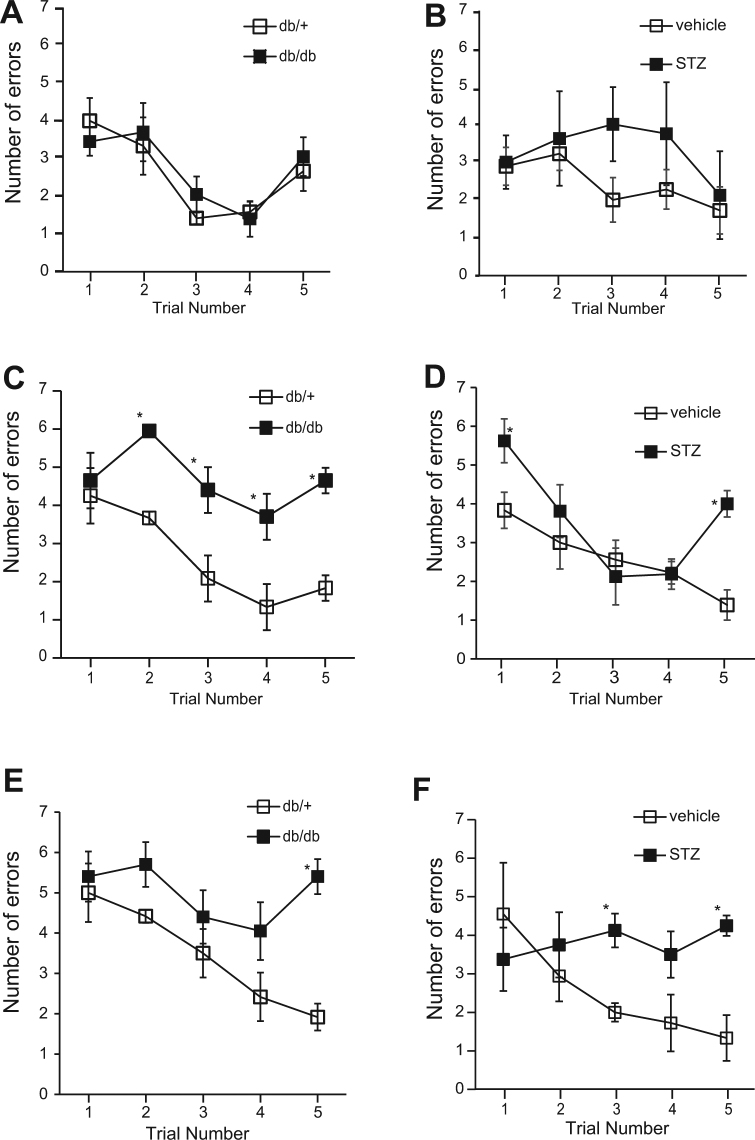
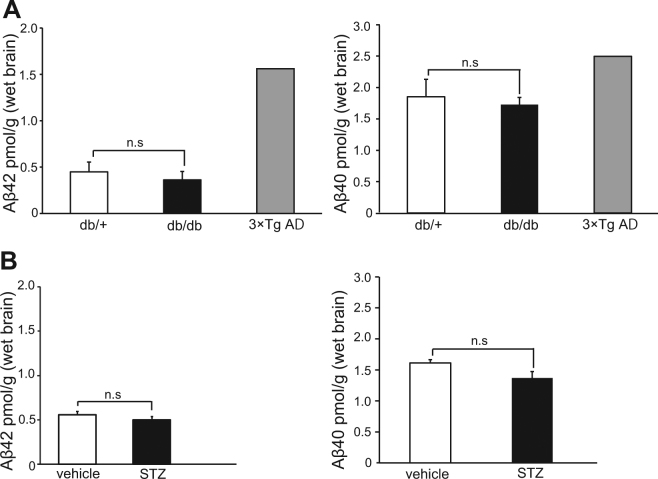
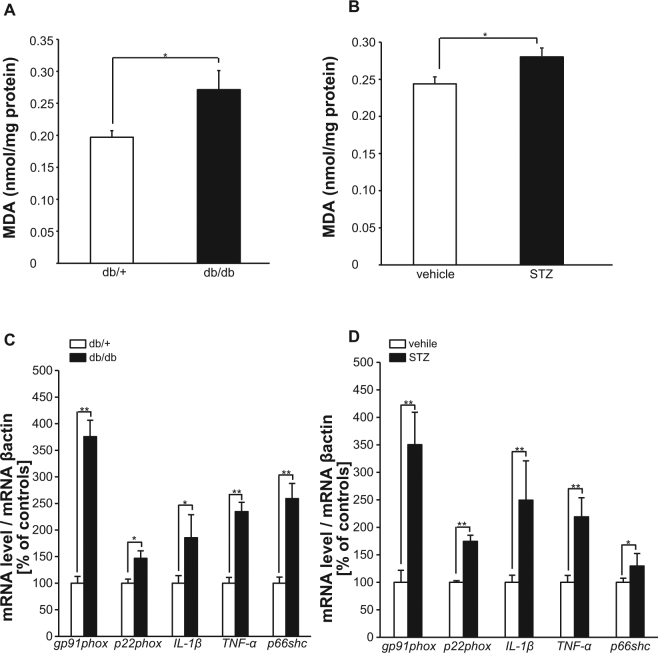
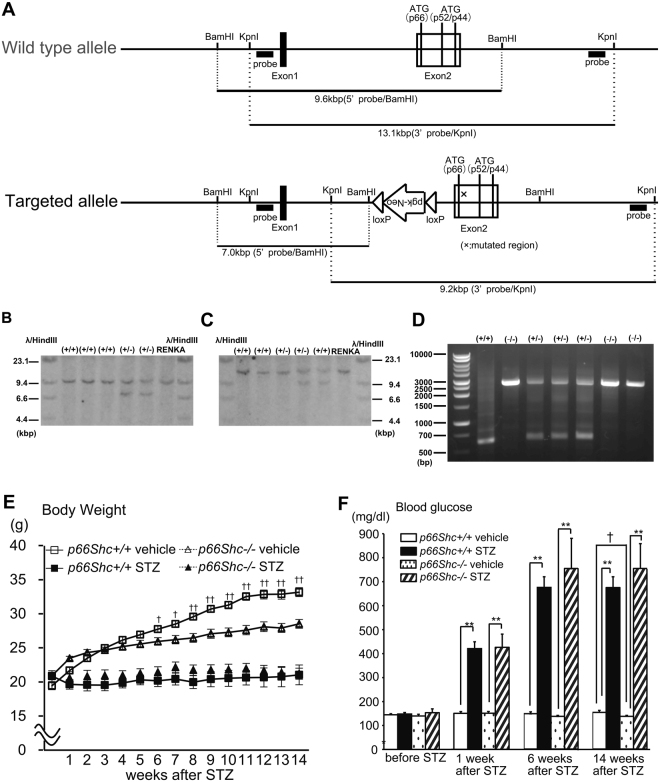
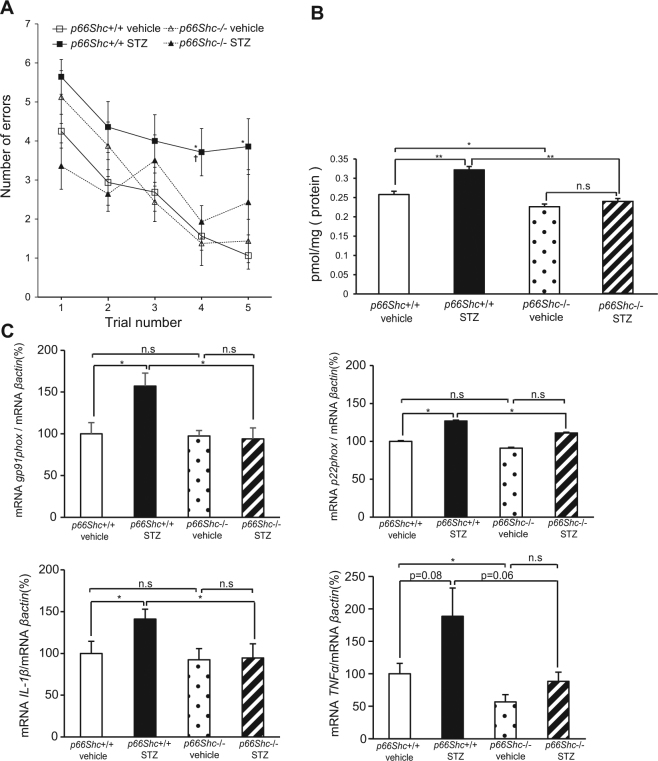
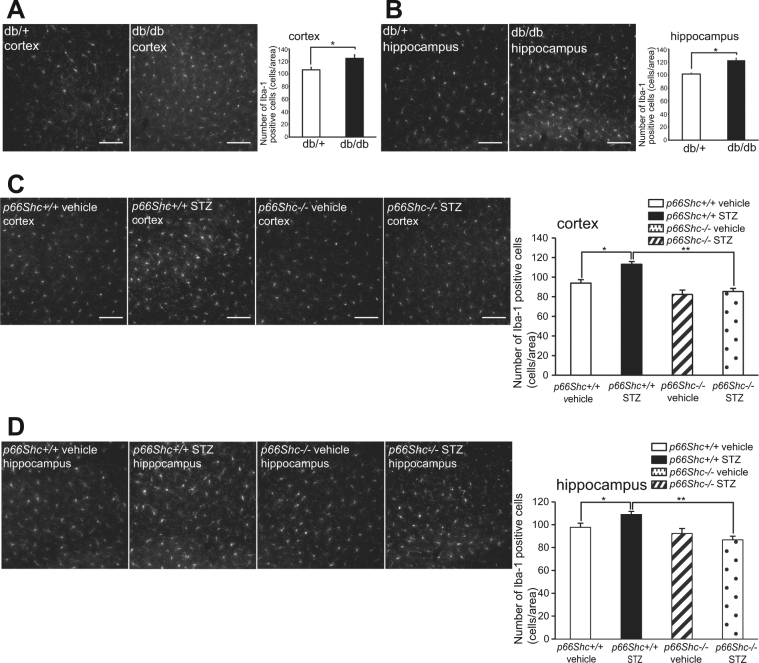
Accumlating evidence have suggested that diabetes mellitus links dementia, notably of Alzheimer's disease (AD). However, the underlying mechanism remains unclear. Several studies have shown oxidative stress (OS) to be one of the major factors in the pathogenesis of diabetic complications. Here we show OS involvement in brain damage in a diabetic animal model that is at least partially mediated through an AD-pathology-independent mechanism apart from amyloid-β accumulation. We investigated the contribution of the p66Shc signaling pathway to diabetes-related cognitive decline using p66Shc knockout (-/-) mice. p66Shc (-/-) mice have less OS in the brain and are resistant to diabetes-induced brain damage. Moreover, p66Shc (-/-) diabetic mice show significantly less cognitive dysfunction and decreased levels of OS and the numbers of microglia. This study postulates a p66Shc-mediated inflammatory cascade leading to OS as a causative pathogenic mechanism in diabetes-associated cognitive impairment that is at least partially mediated through an AD-pathology-independent mechanism.


Conflict of interest statement

The authors declare no competing interests.

Figures

Figure 1
Figure 1
Cognitive Function is Impaired in Diabetic Mice. (AF) The mean number of errors during radial arm water maze (RAWM) performance. (B,D and F) Results for male ICR mice tested 9 (vehicle, n = 9; STZ, n = 5), 14 (vehicle, n = 9; STZ, n = 8), and 22 (vehicle, n = 9; STZ, n = 4) weeks after streptozotocin (STZ) injection, respectively. (A,C,and E) Results for male C57BL/KsJ db/db mice aged 10, 20, and 30 weeks, respectively (db/ + , n = 6; db/db, n = 10). Four consecutive acquisition trials (trials 1–4) are followed, after 30 min, by a retention trial (trial 5). Bars represent means ± SEM. The asterisks indicate significant differences between two groups (*p < 0.05).
Figure 2
Figure 2
Levels of Amyloid Beta (Aβ) 42 and 40 in Brain Homogenates Are Not Increased in Diabetic Mice. Shown are the levels of Aβ42 and Aβ40 measured by ELIZA in whole brain homogenates of (A) 20-week-old db/db mice (db/ + , n = 8; db/db, n = 8) and of (B) ICR mice 22 weeks after STZ injection (vehicle, n = 8; STZ, n = 8). The triple-transgenic Alzheimer’s disease (AD) mouse model (3xTg-AD) is shown as a positive control. Bars represent means ± SEM.
Figure 3
Figure 3
Malondialdehyde (MDA) and mRNA expressions of NAD(P)H Oxidase Components and Inflammatory Cytokines are Increased in Diabetic Mice Brain. (A and B) MDA levels measured by the thiobarbituric acid-reactive substances (TBARS) assay in whole brain homogenates, indicating oxidative stress (OS) levels. Both diabetes models produce significant OS. (A) Results for 30-week-old db/db mice (db/ + , n = 8; db/db, n = 8). (B) Results for ICR mice 22 weeks after STZ injection (vehicle, n = 6; STZ, n = 6). The results are expressed as nanomoles per gram of protein. The asterisks indicate significant differences relative to control mice (*p < 0.05). (C and D) Levels of mRNA expressions of NAD(P)H oxidase components (gp91phox, p22phox), inflammatory cytokines (IL-1β, TNF-α), and p66Shc were measured by real-time RT-PCR assay in brain homogenates from (C) 30-week-old db/db mice (db/ + , n = 7; db/db, n = 7) and from (D) ICR mice 22 weeks after STZ injection (vehicle, n = 6; STZ, n = 6). The mRNA levels are scaled to the β-actin level, converted to percentages of the levels in control mice, and expressed as mean ± SEM. *p < 0.05; **p < 0.01 relative to control mice.
Figure 4
Figure 4
Generation of p66Shc Knockout Mice and Their Phenotypic Characterization after STZ-induction of Diabetes. (AC) Gene-disrupted mice with targeted disruption of p66Shc. (A) Schematic presentation of the genomic structure of p66Shc knockout mice. (B and C) Southern blot analysis of embryonic stem (ES) cell clones. (+/+) Lanes are wild-type ES cell clones and (+/−) lanes are mutated ES cell clones. RENKA is the wild-type ES genome, used as the (+/+) control. (B) 5′ Southern blot; the targeted allele generates a 7.0 kbp BamHI fragment in contrast to the 9.6 kbp wild-type fragment. (C) 3′ Southern blot; the targeted allele generates a 9.2 kbp kpnI fragment in contrast to the 13.1 kbp wild-type fragment. (D) PCR analysis for p66Shc genomic DNA knockout, using the tails. Wild type, (+/+); heterozygous, (+/−); homozygous, (−/−) for p66Shc. A 2566 bp mutant fragment and a 616 bp wild-type fragment are detected. (E,F) Shown are body weight (g) and blood glucose concentrations (mg/dL) in p66Shc knockout mice in STZ-induced diabetes [p66Shc (+/+) vehicle, n = 19; p66Shc (+/+) STZ, n = 16; p66Shc (−/−) vehicle, n = 10; p66Shc (−/−) STZ, n = 8], Data are means ± SEM. Note that there is no significant difference in body weight comparing p66Shc (+/+) STZ vs. p66Shc (−/−) STZ, but a significant difference (p < 0.05) comparing STZ vs. vehicle in each of p66Shc (+/+) and p66Shc (−/−) after STZ injection. (F) Note that there is no significant difference in blood glucose comparing p66Shc (+/+) STZ vs. p66Shc (−/−) STZ. p < 0.05, p66Shc (+/+) vehicle vs. p66Shc (−/−) vehicle; *p < 0.05 and **p < 0.01, STZ vs. vehicle in the same genotype.
Figure 5
Figure 5
Cognitive Impairment on RAWM, Elevation of MDA, and Elevation of mRNA Expressions of NAD(P)H Oxidase Components and Inflammatory Cytokines are Ameliorated in Diabetic Mice by p66Shc Gene Knockout. (A) Mean numbers of errors during RAWM performance in p66Shc knockout mice 14 weeks after STZ injection [p66Shc (+/+) vehicle, n = 8; p66Shc (+/+) STZ, n = 7; p66Shc (−/−) vehicle, n = 8; p66Shc (−/−) STZ, n = 7]. (B) MDA levels measured by the TBARS assay in whole brain homogenates from p66Shc knockout mice, 22 weeks after STZ injection [p66Shc (+/+) vehicle, n = 8; p66Shc (+/+) STZ, n = 8; p66Shc (−/−) vehicle, n = 8; p66Shc (−/−) STZ, n = 8]. (C) Levels of mRNA expressions of NAD(P)H oxidase components (gp91phox, p22phox) and inflammatory cytokines (IL-1β, TNF-α) measured by real-time RT-PCR assay in whole brain homogenates from p66Shc knockout mice, 14 weeks after STZ injection [p66Shc (+/+) vehicle, n = 8; p66Shc (+/+) STZ, n = 8; p66Shc (−/−) vehicle, n = 8; p66Shc (−/−) STZ, n = 7]. *p < 0.05; **p < 0.01.
Figure 6
Figure 6
p66Shc Protein is Highly Expressed in Microglial Cells in the Brain. Western blotting results using anti-Shc protein antibody, (A) with total protein extracted from microglial HAPI (highly aggressively proliferating immortalized) cells, and (B) with total protein extracted from brain microglia of C57B/6 mice. The full-length blotting images are presented in Fig. S2.
Figure 7
Figure 7
Brain Microglia are Proliferated in Diabetic Mice and Suppressed by p66Shc Gene Knockout. (A and B) Counts of Iba1–positive cells in 30-week-old db/db mice (cortex, db/ + , n = 4; cortex, db/db, n = 4; hippocampus, db/+ , n = 6; hippocampus, db/db, n = 6). (C and D) Counts of Iba1–positive cells in p66Shc knockout mice 14 weeks after STZ injection [p66Shc (+/+) vehicle, n = 6; p66Shc (+/+) STZ, n = 6; p66Shc (−/−) vehicle, n = 6; p66Shc (−/−) STZ, n = 6]. Bars represent means ± SEM. *p < 0.05; **p < 0.01.

Similar articles

Cited by

References

    1. Prince M, et al. The global prevalence of dementia: a systematic review and metaanalysis. Alzheimers Dement. 2013;9:63–75. doi: 10.1016/j.jalz.2012.11.007. - DOI - PubMed
    1. Norton S, Matthews FE, Barnes DE, Yaffe K, Brayne C. Potential for primary prevention of Alzheimer’s disease: an analysis of population-based data. Lancet Neurol. 2013;13:788–794. doi: 10.1016/S1474-4422(14)70136-X. - DOI - PubMed
    1. Biessels GJ, Staekenborg S, Brunner E, Brayne C, Scheltens P. Risk of dementia in diabetes mellitus: a systematic review. Lancet Neurol. 2006;5:64–74. doi: 10.1016/S1474-4422(05)70284-2. - DOI - PubMed
    1. Ohara T, et al. Glucose tolerance status and risk of dementia in the community: The Hisayama Study. Neurology. 2011;77:1126–1134. doi: 10.1212/WNL.0b013e31822f0435. - DOI - PubMed
    1. de la Monte SM. Insulin resistance and Alzheimer’s disease. BMB Rep. 2009;42:475–481. doi: 10.5483/BMBRep.2009.42.8.475. - DOI - PMC - PubMed

Publication types

MeSH terms

Substances