. 2018 Feb 16;8(1):3216.
doi: 10.1038/s41598-018-21537-0.

Revisiting the Pacific Meridional Mode

Affiliations

Revisiting the Pacific Meridional Mode

Malte F Stuecker. Sci Rep. .

Abstract

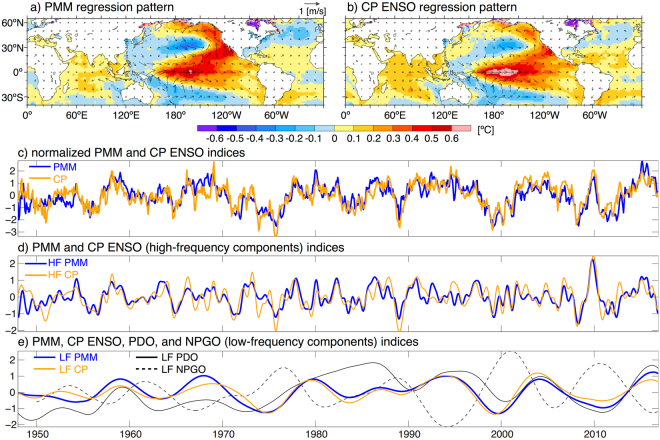
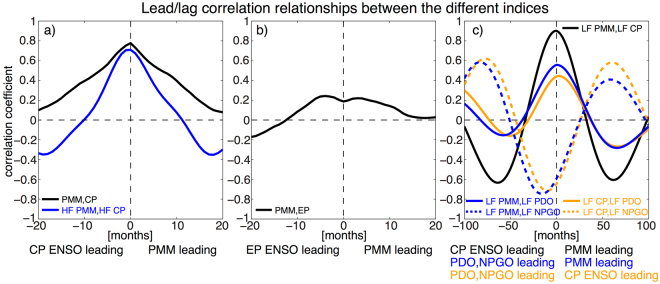
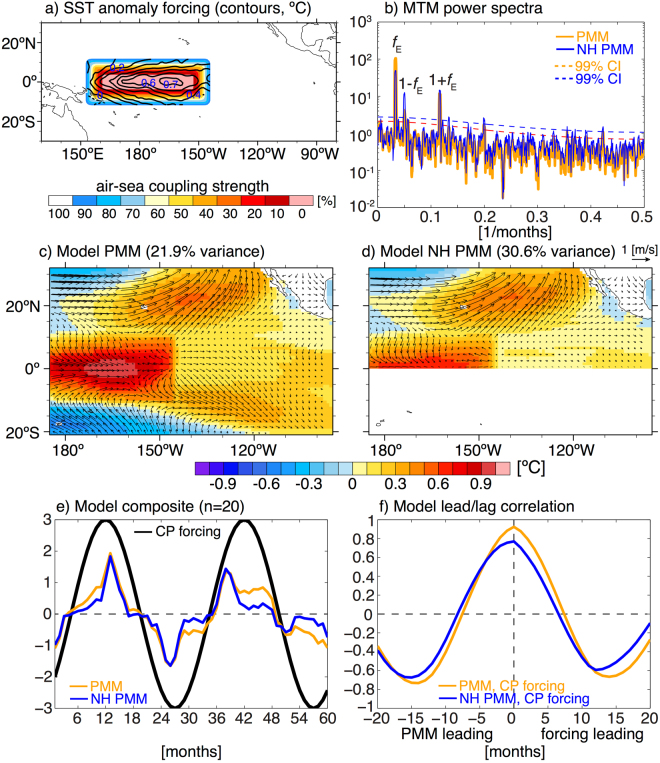
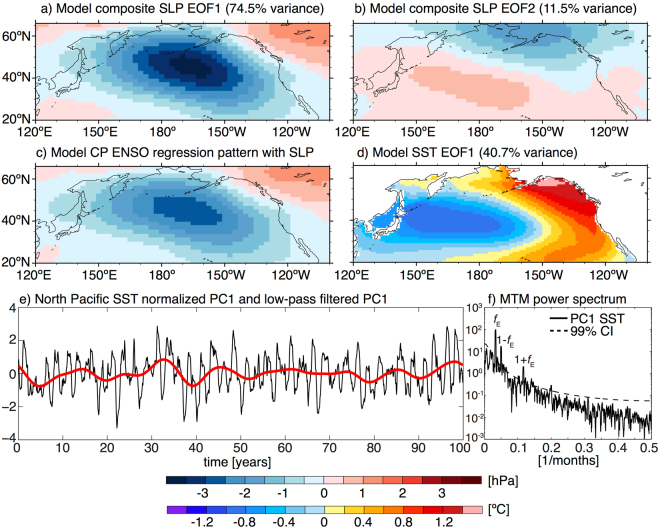
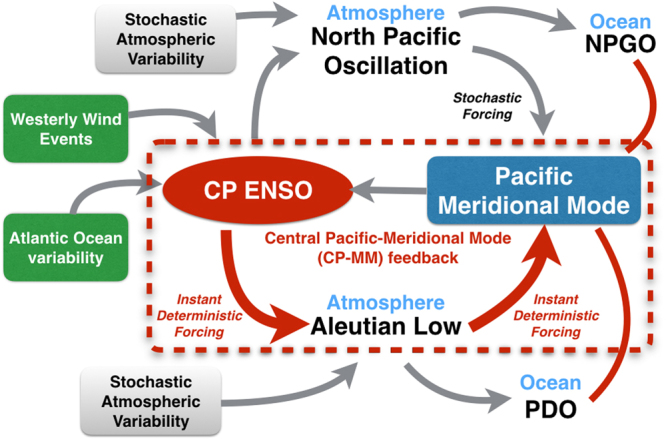
Numerous studies demonstrated that the Pacific Meridional Mode (PMM) can excite Central Pacific (CP) El Niño-Southern Oscillation (ENSO) events and that the PMM is mostly a stochastic phenomenon associated with mid-latitude atmospheric variability and wind-evaporation-SST feedback. Here we show that CP sea surface temperature (SST) variability exhibits high instantaneous correlations both on interannual (ENSO-related) and decadal (Pacific Decadal Oscillation (PDO)-related) timescales with the PMM. By prescribing an idealized interannual equatorial CP ENSO SST forcing in a partially-coupled atmosphere/slab ocean model we are able to generate a realistic instantaneous PMM response consistent with the observed statistical ENSO/PMM relationship. This means that CP ENSO and the PMM can excite each other respectively on interannual timescales, strongly suggesting that a fast positive feedback exists between the two phenomena. Thus, we argue that they cannot be considered two independent dynamical entities. Additionally, we show that the interannual CP ENSO SST forcing generates atmospheric circulation variability that projects strongly on the Aleutian Low and North Pacific SST anomalies that exhibit the characteristic PDO pattern.


Conflict of interest statement

The author declares no competing interests.

Figures

Figure 1
Figure 1
(a,b) Instantaneous SST (°C) and surface wind (m/s) regression patterns for the anomalous normalized (a) PMM and (b) CP ENSO indices. (c) Time series of the anomalous normalized PMM (blue) and CP ENSO (orange) indices (no units) from 1948–2016. (d) Same as (c) but for the high-frequency (HF) components of these indices. (e) Same as (c) but for the low-frequency (LF) components of these indices. Shown additionally are the LF components of the PDO (solid black) and NPGO (dashed black) indices. The maps in this figure were created using NCAR Command Language Version 6.4.0 (10.5065/D6WD3XH5).
Figure 2
Figure 2
(a) Lead/lag correlation between the CP ENSO and PMM indices (solid black) and between the high-frequency components HF CP ENSO and HF PMM (solid blue). (b) Lead/lag correlation between the EP ENSO and PMM indices (solid black). (c) Lead/lag correlation between the low-frequency components LF CP ENSO and LF PMM (solid black), LF PMM and LF PDO (solid blue), LF PMM and LF NPGO (dashed blue), LF CP ENSO and LF PDO (solid orange), and LF CP ENSO and LF NPGO (dashed orange).
Figure 3
Figure 3
(a) CP ENSO SST anomaly forcing pattern (contours, °C) and the PARCP air-sea coupling mask (shading, %). (b) MTM power spectra (no unit) for the normalized PMM (solid orange) and NH PMM (solid blue) indices from the full (non-composite) model experiment. Dashed lines indicate the 99% confidence interval for an AR(1) null hypothesis. The forcing frequency (fE) and the first-order combination tones (1 ± fE) are labeled. (c,d) SST (shading, °C) and low level wind (vectors, m/s) regression patterns for the leading statistical modes of the full model simulation for the traditional PMM domain (c) and for the Northern Hemisphere (NH) PMM domain (d) respectively. (e) Composite time evolution of the CP ENSO forcing (black, no unit) and the normalized simulated PMM (orange, no unit) and NH PMM (blue, no unit) indices. (f) Lead/lag correlation between the composite CP ENSO forcing and the composite PMM (orange) and NH PMM (blue) indices respectively. The maps in this figure were created using NCAR Command Language Version 6.4.0 (10.5065/D6WD3XH5).
Figure 4
Figure 4
(a,b) Leading two EOF modes of model composite simulated SLP anomaly variability in the North Pacific (shading, hPa). EOF1 (a) projects on the Aleutian Low and EOF2 (b) has a structure associated with the North Pacific Oscillation (NPO). (c) North Pacific simulated SLP anomaly regression pattern (shading, hPa) for the full (non-composite) model normalized CP ENSO SST anomaly forcing time series. (d) Leading North Pacific SST anomaly EOF (shading, °C) for the full model simulation. (e) Corresponding normalized PC1 (black) and the 8 years low-pass filtered PC1 (red). (f) MTM power spectrum (no unit) for the normalized PC1. The dashed line indicates the 99% confidence interval for an AR(1) null hypothesis. The forcing frequency (fE) and the first-order combination tones (1 ± fE) are labeled. The maps in this figure were created using NCAR Command Language Version 6.4.0 (10.5065/D6WD3XH5).
Figure 5
Figure 5
Schematic for the discussed mechanisms (motivated by Fig. 3 in Di Lorenzo et al.). Grey arrows indicate previously identified pathways (refer to the Introduction section for details) and red arrows the new pathways proposed in this study that enable an instantaneous positive feedback between CP ENSO and PMM (encircled by the dashed red line), which is able to explain the observed close CP ENSO/PMM relationship at zero lag on all climate timescales. The solid red lines indicate close relationships between PMM, PDO, and NPGO at low-frequencies. Note that stochastic processes can affect (in differing strength) each of the pathways indicated by arrows.

References

    1. Rasmusson EM, Carpenter TH. Variations in Tropical Sea Surface Temperature and Surface Wind Fields Associated with the Southern Oscillation/El Niño. Mon. Wea. Rev. 1982;110:354–384. doi: 10.1175/1520-0493(1982)110<0354:VITSST>2.0.CO;2. - DOI
    1. Philander, S. G. El Niño Southern Oscillation phenomena. Nature302, 10.1038/302295a0 (1983).
    1. Stuecker MF, Timmermann A, Jin F-F, McGregor S, Ren H-L. A combination mode of the annual cycle and the El Niño/Southern Oscillation. Nature Geosci. 2013;6:540–544. doi: 10.1038/ngeo1826. - DOI
    1. Stuecker MF, Jin F-F, Timmermann A. El Niño-Southern Oscillation frequency cascade. Proc. Natl. Acad. Sci. USA. 2015;112:13490–13495. doi: 10.1073/pnas.1508622112. - DOI - PMC - PubMed
    1. Frankignoul C, Hasselmann K. Stochastic climate models, Part II Application to sea-surface temperature anomalies and thermocline variability. Tellus. 1977;29:289–305. doi: 10.3402/tellusa.v29i4.11362. - DOI

Publication types

LinkOut - more resources