. 2018 Feb 16;8(1):3156.
doi: 10.1038/s41598-018-21535-2.

Neovasculature can be induced by patching an arterial graft into a vein: A novel in vivo model of spontaneous arteriovenous fistula formation

Affiliations

Neovasculature can be induced by patching an arterial graft into a vein: A novel in vivo model of spontaneous arteriovenous fistula formation

Yukinobu Ito et al. Sci Rep. .

Abstract

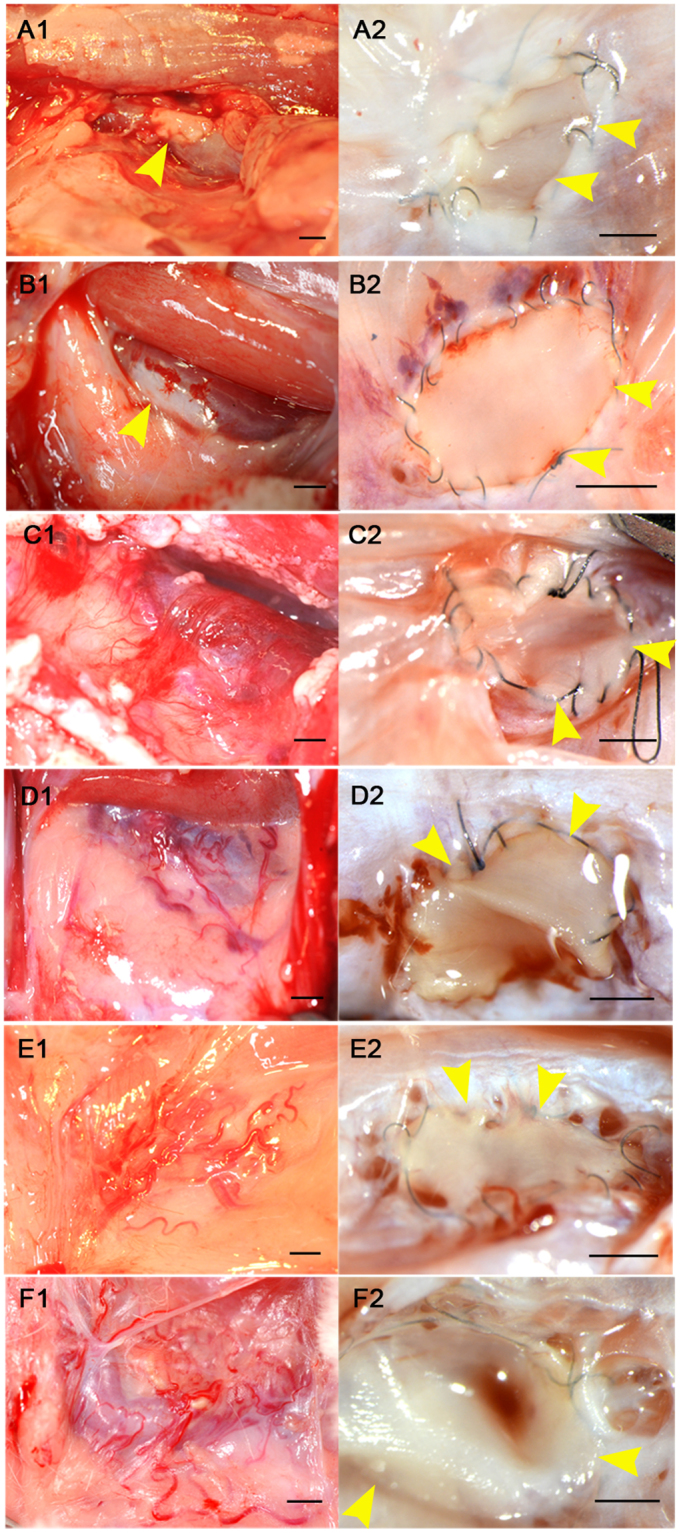
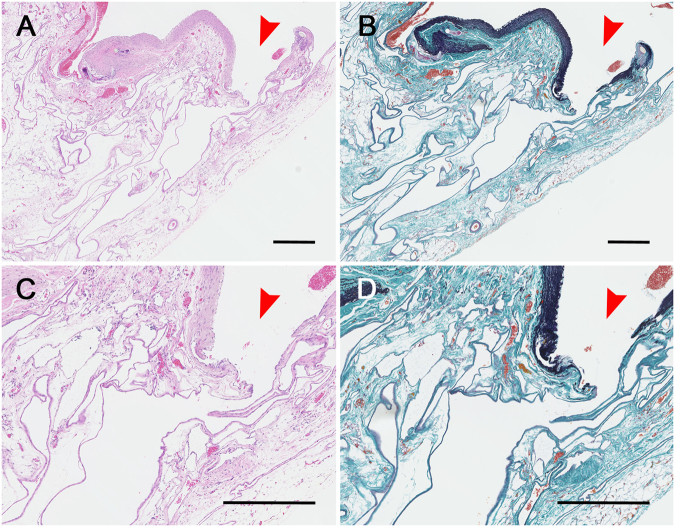
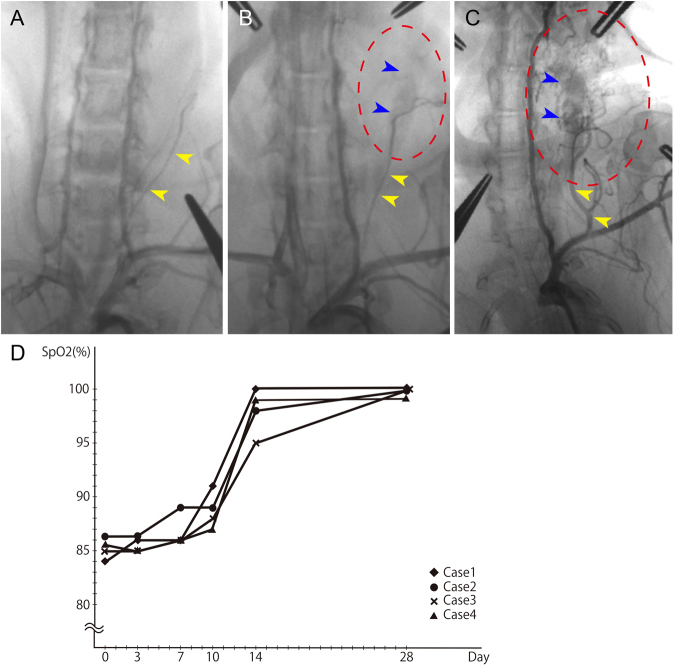
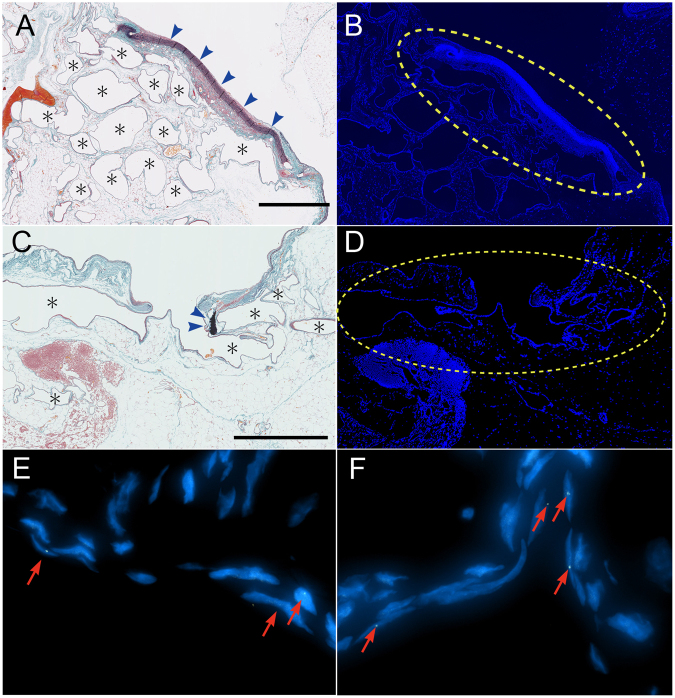
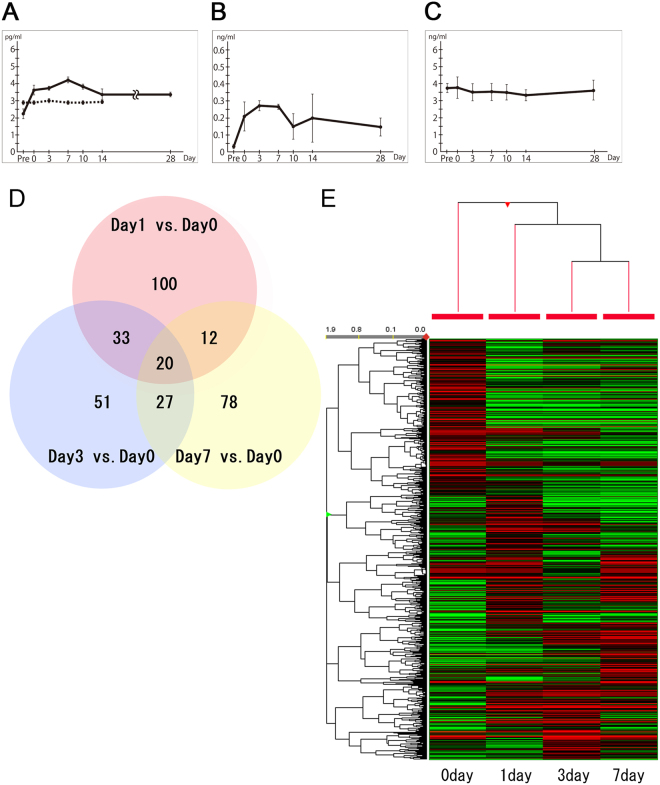
Arteriovenous malformations consist of tangles of arteries and veins that are often connected by a fistula. The causes and mechanisms of these clinical entities are not fully understood. We discovered that suturing an arterial patch into the common jugular vein of rabbits led to spontaneous neovascularization, the formation of an arteriovenous fistula and the development of an arteriovenous shunt. An arterial patch excised from the common carotid artery was sutured into the common jugular vein. Within a month, a dense nidus-like neovasculature formed around the patch. Angiography and pulse-oximeter analyses showed that the blood flowing into the neovasculature was arterial blood. This indicated that an arteriovenous shunt had formed. Fluorescence in situ hybridization with a Y chromosome probe in female rabbits that received an arterial patch from male rabbits showed that the vessels close to the graft bore the Y chromosome, whereas the vessels further away did not. Enzyme-linked immunosorbent assays and cDNA microarray analysis showed that multiple angiogenic factors were upregulated after patch transplantation. This is the first in vivo model of spontaneous arteriovenous fistula formation. Further research on these differences may help to improve understanding of human vascular anomaly diseases and the basic principles underlying vasculogenesis and/or angiogenesis.


Conflict of interest statement

The authors declare no competing interests.

Figures

Figure 1
Figure 1
The patch procedure used to generate the spontaneous arteriovenous fistula formation model. (A) The anatomy of the cervical vessels in rabbits. (B) The patch procedure starts with dissection and ligation of the left common carotid artery (LtCCA) about 10 mm superior to the thyroid artery. The artery is cut so that 6–7 mm of arterial tissue can be collected. The arterial tissue is opened up into a rectangle and then trimmed to form an oval. Thereafter, the left common jugular vein (LtCJV) is revealed by dissection and a 7 mm incision is made into the blocked portion under haemostasis. (C) The trimmed arterial tissue is sewn into the LtCJV in a patchwork manner. (D) A transverse section of the LtCJV bearing the arterial patch is shown. (E) One year after the patch procedure, neovasculature was induced around the arterial patch graft. The neovasculature resembled arteriovenous malformation (AVM).
Figure 2
Figure 2
Formation of new blood vessels over time. (A1F1) are representative macroscopic views of the patch-bearing vein on days 3, 7, 10, 14, 28 and 84, respectively. (A2F2) are representative stereomicroscope photographs of the luminal side of the arterial patch (yellow arrowhead) on the vein on the same days. On day 3, blood vessels and the apertures of new blood vessels around the arterial tissue (yellow arrowhead) cannot be seen (A1 and A2). On day 7, there are hazy capillary-like structures around the adipose tissue but no holes (B1 and B2). On day 10, the LtCJV turned a brighter red colour and there were a few small holes around the margin of the arterial patch (C1 and C2). On day 14, the adipose tissue around the arterial patch had clearly visible neovasculature that flexed and meandered and the holes had become larger (D1 and D2). On day 28, the new blood vessels and the shunting were even more pronounced and the apertures of the new blood vessels at the margin of the patch were even larger (E1 and E2). On day 84, there were many new blood vessels around the common jugular vein and in its surrounding adipose tissue and the vein was brighter than before and had turbulent blood flow (F1). There were large holes around the arterial patch (F2). Scale bar = 5 mm.
Figure 3
Figure 3
Histological findings 28 days after the patch procedure. (A and B) Histology of the arterial patch on the left common jugular vein on day 28 showed that new blood vessels had opened at the margin of the arterial patch (A: Haematoxylin-Eosin-stain, 40×; B: Elastica-Masson-stain, 40×). (C and D) The new blood vessels had thin walls and extended in an irregular fashion (C: Haematoxylin-Eosin-stain, 150×; D: Elastica-Masson-stain, 150×). Scale bar for (A–D) = 0.5 mm. The red arrowhead indicates the opening of a new blood vessel.
Figure 4
Figure 4
Formation of an arteriovenous shunt around the arterial patch, as shown by angiography and pulse-oximetry. Angiography of the arterial patch-bearing left common jugular vein was performed on day 3 (A) and day 28 (B) with contrast agent in the early arterial phase. The arteriovenous shunt had not formed on day 3 (yellow arrowheads, the left subclavian artery). On day 28, an arteriovenous shunt had formed, and its blood flow originated from the second branch of the left subclavian artery (yellow arrowheads). The left common jugular vein, which was a drainage vein, was enhanced in the arterial phase (blue arrowheads). (C) Angiography on day 84 showed that the feeding artery of the arteriovenous shunt had grown and that the new blood vessels were larger than they had been on day 28. The ovals in B and C that are demarcated by red dashes contain new blood vessels. Representative images are shown in (A–C). (D) Oxygen saturation in the left common jugular vein over time. Between day 0 and day 7, the oxygen saturation did not change. However, on days 10–14, the oxygen saturation started to rise sharply. On day 14 and thereafter, the oxygen saturation exceeded 95%. Thus, the blood in the vein after day 14 was of arterial origin, which indicated that the shunt was established around that time point. Scale bar = 1 cm.
Figure 5
Figure 5
Origin of the new vessels, as shown by fluorescence in situ hybridization (FISH). The patch procedure was performed in two female rabbits with an arterial patch from male rabbits. FISH was performed on day 28 with a Cy3-labelled Y chromosome-specific probe. Representative images are shown. (A and C) Elastica-Masson-stained sections of the patch-bearing left common jugular vein. There were new blood vessels (indicated by *) around the arterial tissue (blue arrowhead) (magnification, 40×). (BF) FISH of the same sections. The Y chromosome of the patch donor was detected in the area circled by the yellow dotted lines (B and D; magnification, 40×). The endothelial cells of the new blood vessels bore the Y chromosome-specific probe (red arrow) (E and F; magnification, 400×). Scale bar = 5 mm.
Figure 6
Figure 6
Molecular response to arterial patch grafting, as determined by enzyme-linked immunosorbent assay (ELISA) and cDNA microarray analysis. (AC) Serum ELISA data. (A) In the arterial patch model (solid line), vascular endothelial growth factor A (VEGFA) levels rose rapidly immediately after the operation. They gradually increased until day 7 (solid line). A control model in which a vein patch was placed in the left common jugular vein did not exhibit any changes in serum VEGFA levels after the operation (dotted line). (B) Hypoxia-inducible factor (HIF)-1α responded similarly to VEGFA except that it showed a small drop on day 10. (C) Transforming growth factor (TGF)-β1 levels did not show any marked changes throughout the observation period. (D) cDNA microarray data. The Venn diagram shows the relationships between the genes that were upregulated by more than 4-fold at the graft site on days 1, 3 and 7, as compared with day 0. Twenty genes were upregulated on all 3 days. (E) Heat map of differentially expressed genes. Gene expression markedly changed after day 0.

Similar articles

Cited by

References

    1. Nakabayashi T, Kudo M, Hirasawa T, Kuwano H. Arteriovenous malformation of the jejunum detected by arterial-phase enhanced helical CT, a case report. Hepato-gastroenterology. 2004;51:1066–1068. - PubMed
    1. Jellema K, et al. Spinal dural arteriovenous fistulas are not associated with prothrombotic factors. Stroke; a journal of cerebral circulation. 2004;35:2069–2071. doi: 10.1161/01.STR.0000135766.22285.dc. - DOI - PubMed
    1. Steinmetz MP, et al. Outcome after the treatment of spinal dural arteriovenous fistulae: a contemporary single-institution series and meta-analysis. Neurosurgery. 2004;55:77–87. doi: 10.1227/01.NEU.0000126878.95006.0F. - DOI - PubMed
    1. Lalitha N, Seetha P, Shanmugasundaram R, Rajendiran G. Uterine Arteriovenous Malformation: Case Series and Literature Review. Journal of obstetrics and gynaecology of India. 2016;66:282–286. doi: 10.1007/s13224-015-0680-2. - DOI - PMC - PubMed
    1. Caselitz M, et al. Clinical outcome of transfemoral embolisation in patients with arteriovenous malformations of the liver in hereditary haemorrhagic telangiectasia (Weber-Rendu-Osler disease) Gut. 1998;42:123–126. doi: 10.1136/gut.42.1.123. - DOI - PMC - PubMed

Publication types

LinkOut - more resources