. 2018 Feb 16;8(1):3159.
doi: 10.1038/s41598-018-21484-w.

Systematic and stochastic influences on the performance of the MinION nanopore sequencer across a range of nucleotide bias

Affiliations

Systematic and stochastic influences on the performance of the MinION nanopore sequencer across a range of nucleotide bias

Raga Krishnakumar et al. Sci Rep. .

Abstract

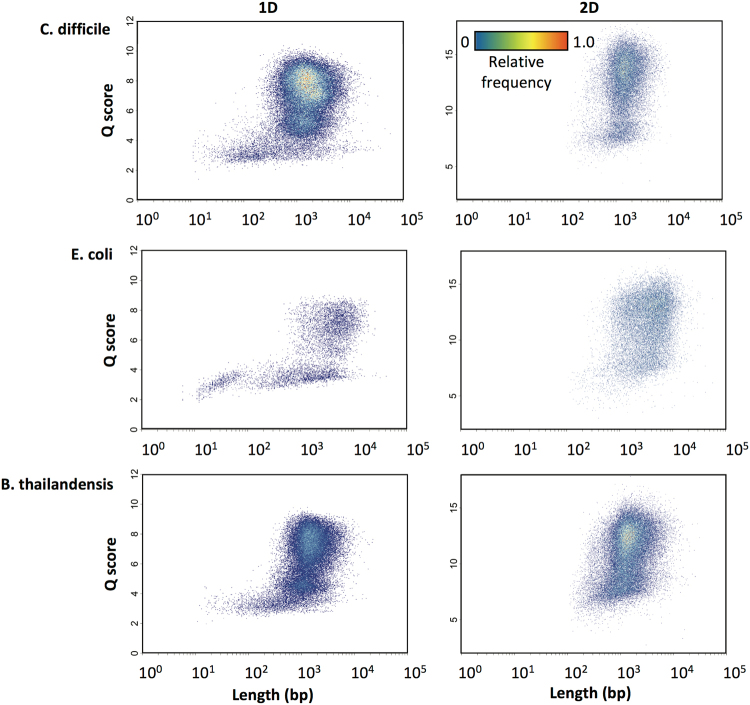
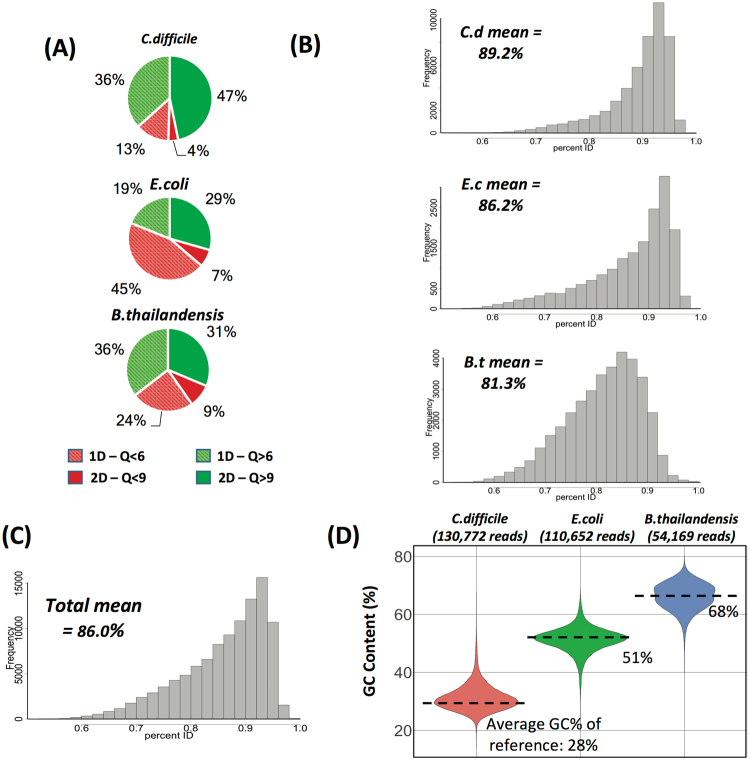
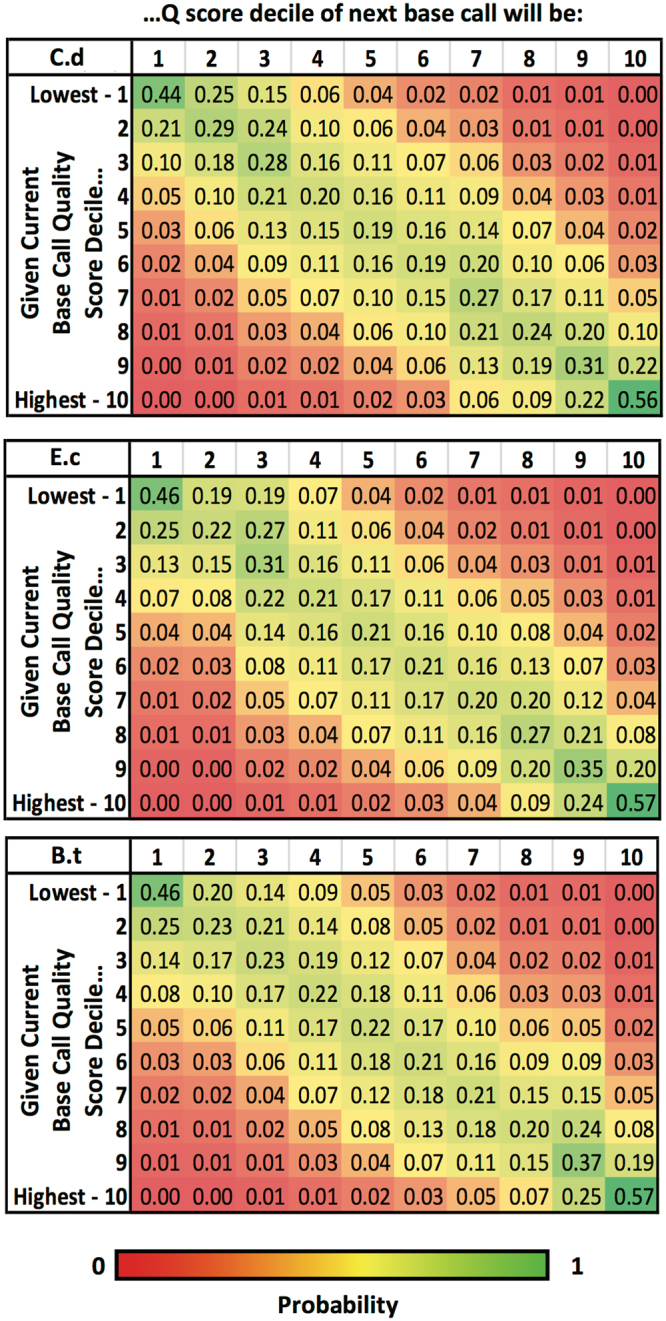
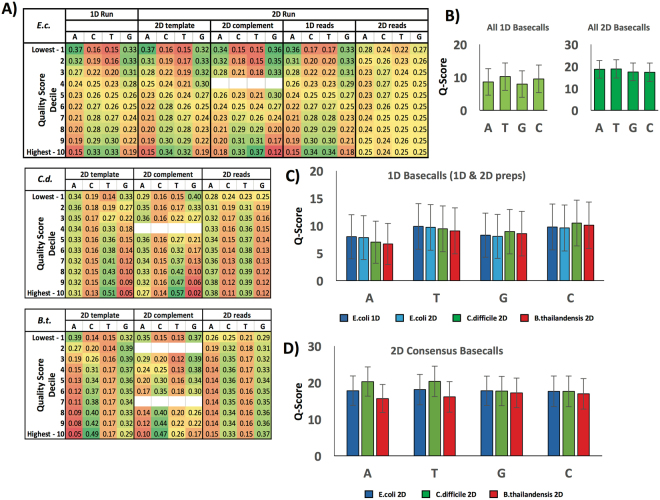
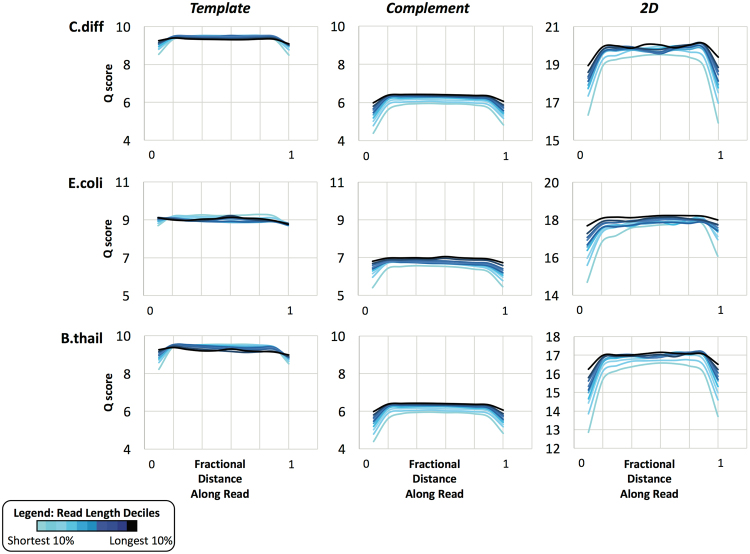
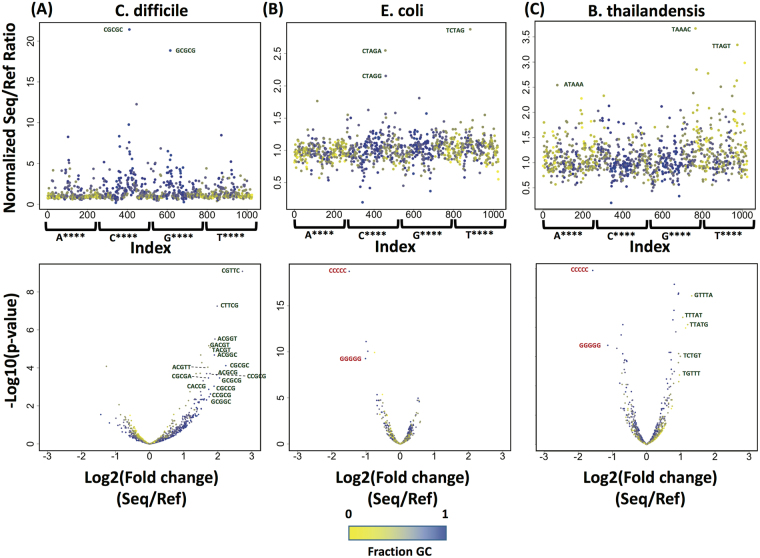
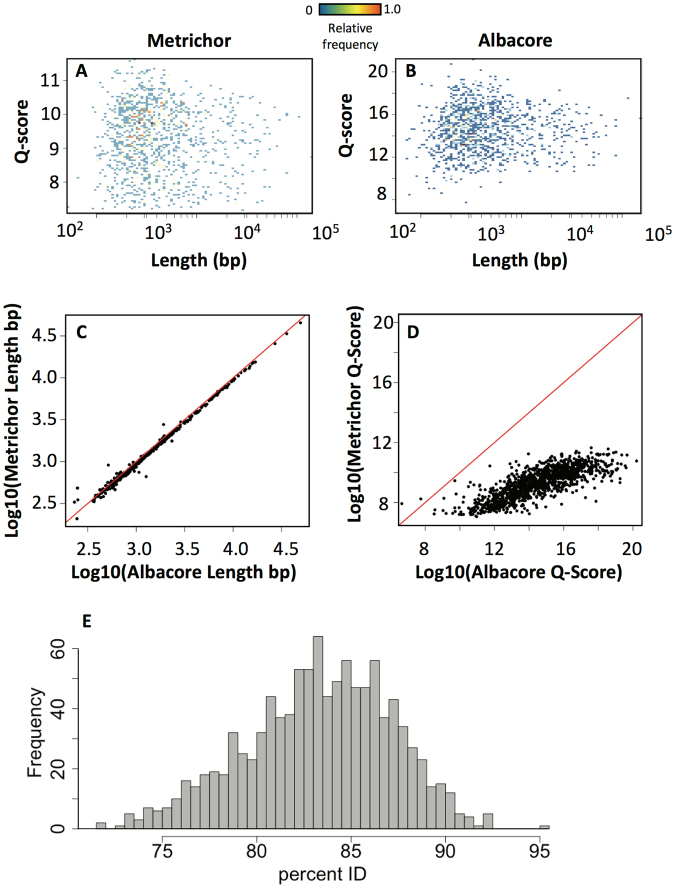
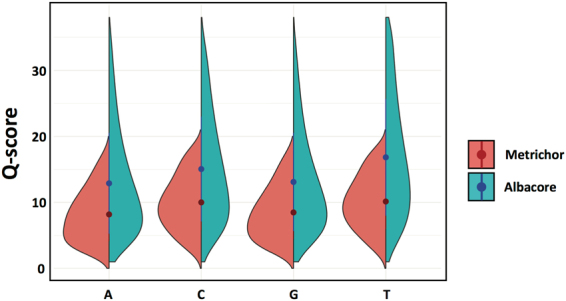
Emerging sequencing technologies are allowing us to characterize environmental, clinical and laboratory samples with increasing speed and detail, including real-time analysis and interpretation of data. One example of this is being able to rapidly and accurately detect a wide range of pathogenic organisms, both in the clinic and the field. Genomes can have radically different GC content however, such that accurate sequence analysis can be challenging depending upon the technology used. Here, we have characterized the performance of the Oxford MinION nanopore sequencer for detection and evaluation of organisms with a range of genomic nucleotide bias. We have diagnosed the quality of base-calling across individual reads and discovered that the position within the read affects base-calling and quality scores. Finally, we have evaluated the performance of the current state-of-the-art neural network-based MinION basecaller, characterizing its behavior with respect to systemic errors as well as context- and sequence-specific errors. Overall, we present a detailed characterization the capabilities of the MinION in terms of generating high-accuracy sequence data from genomes with a wide range of nucleotide content. This study provides a framework for designing the appropriate experiments that are the likely to lead to accurate and rapid field-forward diagnostics.


Conflict of interest statement

The authors declare no competing interests.

Figures

Figure 1
Figure 1
Frequency-normalized 2D histograms of average read Q-score versus read length for 1D and 2D reads (both from 2D sequencing) of C. difficile (111k reads), E. coli (54k reads), and B. thailandensis (131k reads).
Figure 2
Figure 2
MinION sequencing results for bacterial genomes of varying GC content. (A) Pass/fail quality score distributions for 2D-sequencing produced reads (Q > 6 for 1D pass, Q > 9 for 2D pass). Solid slices are 2D reads (template and complement consensus), and striped slices are 1D reads (template only). (B) Histogram of percentage identity of reads to reference genome sequences for C. difficile (top), E. coli (middle) and B. thailandensis (bottom). (C) Aggregate histogram of percentage identity of all reads to the three reference genome sequences. (D) Violin plots showing the percent GC content of reads from MinION sequencing for C. difficile, E. coli, and B. thailandensis. Dotted lines indicate the GC content of the GenBank reference genome sequences.
Figure 3
Figure 3
Relatedness of Q-scores across individual basecalls. Average Q-score of each read was broken into individual Q-scores per base, and then divided into ten deciles. Given a Q-score decile for the current base, the probability of the next base having a Q-score in each of the ten deciles was calculated. The probabilities are shown in heat map format for C. difficile (top), E. coli (middle), and B. thailandensis (bottom).
Figure 4
Figure 4
(A) Heat map chart showing probability of basecalls in a particular Q-score decile being A, C, T or G. After dividing base Q-scores into deciles (as in Fig. 3), the probability that the base is A, C, T or G, given a Q-score decile was calculated. 1D and 2D data are shown for E.coli (top), while only 2D run data are shown for C. difficile (middle) and B. thailandensis (bottom). Note – rounding error may cause some groupings to appear not to sum to 1.00 even though the unrounded numbers do. (B) Averages of Q-scores per base for C. difficile, E. coli and B. thailandensis data. (C) Average data in (A) for 1D and 2D (template only) reads, broken down by organism. (D) Data in (A) for 2D consensus reads, broken down by organism.
Figure 5
Figure 5
Variation in basecall quality as a function of position within MinION reads. 2D sequenced reads are grouped into deciles based on length. Q-scores as a function of length-normalized position within individual reads are averaged within each length decile group and plotted for template, complement, and 2D consensus basecall results.
Figure 6
Figure 6
Sequence bias informs k-mer bias during sequencing. Top: Coverage-normalized ratio of occurrence of all possible 5-mers in the MinION sequencing data over the reference genome, for E. coli (A), B. thailandensis (B), and C. difficile (C), arranged alphabetically from AAAAA to TTTTT. Points are colored based on fraction GC content. Bottom: Negative binomial linear regression plotted as p-value versus fold change (i.e., volcano plot). Annotations indicate 5-mers with at least a 2-fold (E. coli, B. thailandensis) or 2.5-fold (C. difficile) difference in representation in the sequencing data versus the reference genome sequence.
Figure 7
Figure 7
Comparing Metrichor to the new Albacore basecaller using a E. coli genomic DNA sequenced with the 1D rapid kit. (A,B) 2D histograms of Q-score versus length for reads basecalled by Metrichor (A) and Albacore (B). (C) Comparison of individual read lengths obtained by Metrichor (y-axis) and Albacore (x-axis). (D) Comparison of individual read Q-scores obtained by Metrichor (y-axis) and Albacore (x-axis). (E) Histogram of percent identity mapping between individual reads basecalled by Metrichor and by Albacore.
Figure 8
Figure 8
Per base comparison of Metrichor and Albacore. Split violin plots showing the distribution of Q-scores per base for Metrichor (red) and Albacore (blue). The dots represent the means of each split violin, and lines from the center represent the standard deviations.

Similar articles

Cited by

References

    1. Chen YC, Liu T, Yu CH, Chiang TY, Hwang CC. Effects of GC bias in next-generation-sequencing data on de novo genome assembly. PLoS One. 2013;8:e62856. doi: 10.1371/journal.pone.0062856. - DOI - PMC - PubMed
    1. Benjamini Y, Speed TP. Summarizing and correcting the GC content bias in high-throughput sequencing. Nucleic Acids Res. 2012;40:e72. doi: 10.1093/nar/gks001. - DOI - PMC - PubMed
    1. Eid J, et al. Real-time DNA sequencing from single polymerase molecules. Science. 2009;323:133–138. doi: 10.1126/science.1162986. - DOI - PubMed
    1. Flusberg BA, et al. Direct detection of DNA methylation during single-molecule, real-time sequencing. Nat Methods. 2010;7:461–465. doi: 10.1038/nmeth.1459. - DOI - PMC - PubMed
    1. Jain M, et al. Improved data analysis for the MinION nanopore sequencer. Nat Methods. 2015;12:351–356. doi: 10.1038/nmeth.3290. - DOI - PMC - PubMed

Publication types