. 2018 May;41(3):337-353.
doi: 10.1007/s10545-017-0131-6. Epub 2018 Feb 16.

Next-generation metabolic screening: targeted and untargeted metabolomics for the diagnosis of inborn errors of metabolism in individual patients

Affiliations

Next-generation metabolic screening: targeted and untargeted metabolomics for the diagnosis of inborn errors of metabolism in individual patients

Karlien L M Coene et al. J Inherit Metab Dis. 2018 May.

Abstract

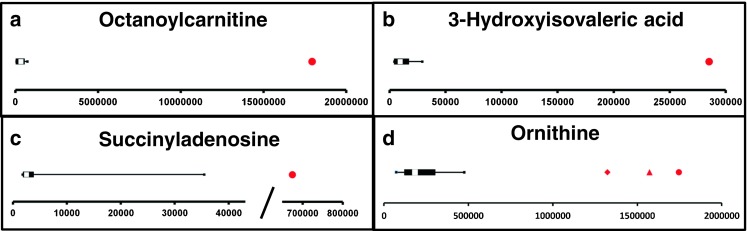
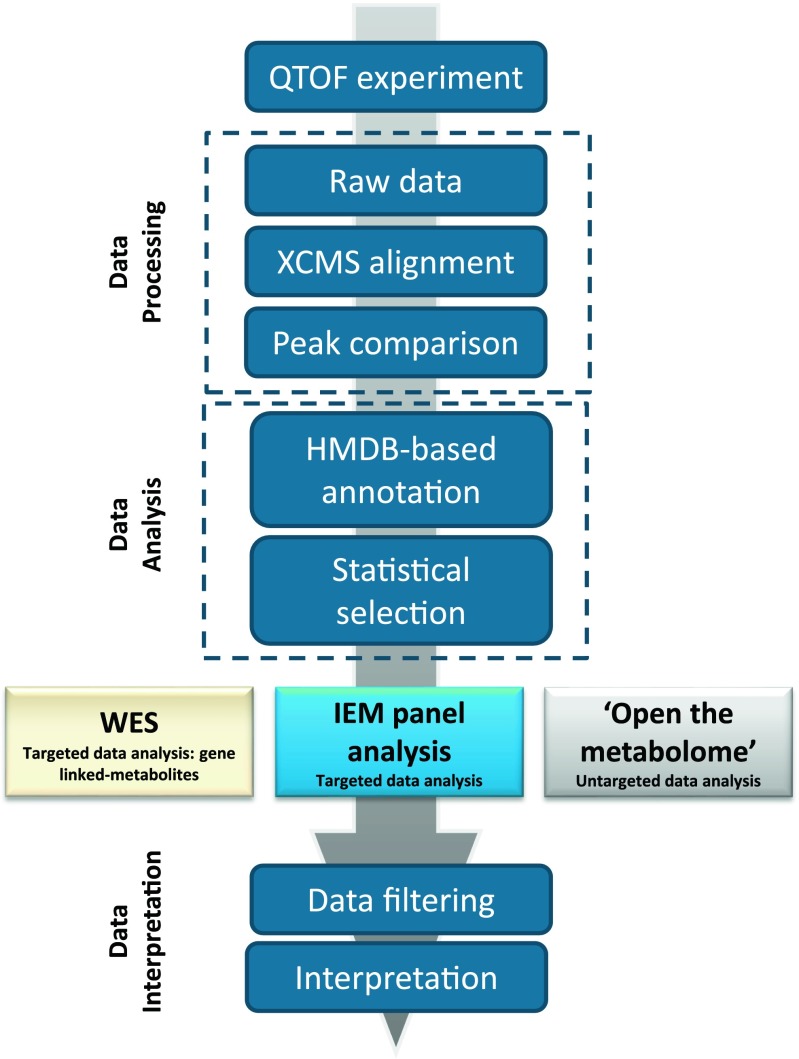
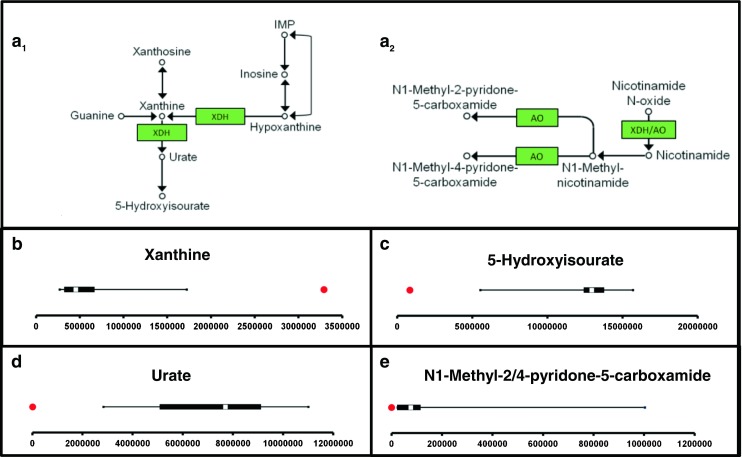
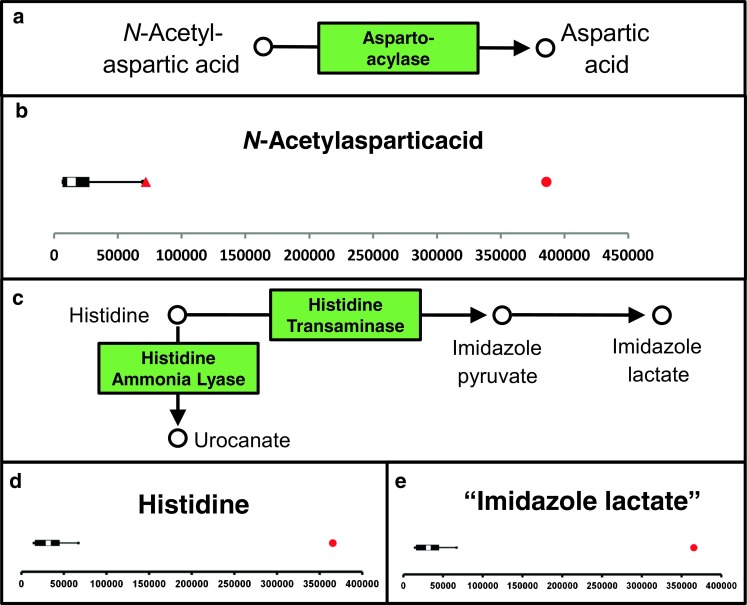
The implementation of whole-exome sequencing in clinical diagnostics has generated a need for functional evaluation of genetic variants. In the field of inborn errors of metabolism (IEM), a diverse spectrum of targeted biochemical assays is employed to analyze a limited amount of metabolites. We now present a single-platform, high-resolution liquid chromatography quadrupole time of flight (LC-QTOF) method that can be applied for holistic metabolic profiling in plasma of individual IEM-suspected patients. This method, which we termed "next-generation metabolic screening" (NGMS), can detect >10,000 features in each sample. In the NGMS workflow, features identified in patient and control samples are aligned using the "various forms of chromatography mass spectrometry (XCMS)" software package. Subsequently, all features are annotated using the Human Metabolome Database, and statistical testing is performed to identify significantly perturbed metabolite concentrations in a patient sample compared with controls. We propose three main modalities to analyze complex, untargeted metabolomics data. First, a targeted evaluation can be done based on identified genetic variants of uncertain significance in metabolic pathways. Second, we developed a panel of IEM-related metabolites to filter untargeted metabolomics data. Based on this IEM-panel approach, we provided the correct diagnosis for 42 of 46 IEMs. As a last modality, metabolomics data can be analyzed in an untargeted setting, which we term "open the metabolome" analysis. This approach identifies potential novel biomarkers in known IEMs and leads to identification of biomarkers for as yet unknown IEMs. We are convinced that NGMS is the way forward in laboratory diagnostics of IEMs.

Keywords: Biomarkers; Canavan disease; High-resolution; Inborn errors of metabolism; Innovative laboratory diagnostics; Mass spectrometry; Metabolomics; QTOF; Xanthinuria.


Conflict of interest statement

Conflict of interest

K. L. M. Coene, L. A. J. Kluijtmans, E. van der Heeft, U. F. H. Engelke, S. de Boer, B. Hoegen, H. J. T. Kwast, M. van de Vorst, M. C. D. G. Huigen, I. M. L.W. Keularts, M. F. Schreuder, C. D. M. van Karnebeek, S. B. Wortmann, M. C. de Vries, M. C. H. Janssen, C. Gilissen, J. Engel and R. A. Wevers declare that they have no conflict of interest.

Informed consent

All procedures followed were in accordance with the ethical standards of the responsible committee on human experimentation (institutional and national) and with the Helsinki Declaration of 1975, as revised in 2000. Informed consent was obtained from all patients (or their legal guardians) for being included in the study.

Figures

Fig. 1
Fig. 1
Feature intensity for a selection of inborn errors of metabolism (IEMs.) In all panels, boxplots show feature intensity distribution in control plasma samples, the X-axis represents feature peak area in arbitrary units. The black box represents the middle 50% of the distribution in control plasma samples; white square represents median of this distribution; left and right whiskers represent lowest and highest value measured in controls. Patient values are shown in red. a Medium-chain acyl-CoA dehydrogenase deficiency: data shown for octanoylcarnitine, m/z 288.2179 ([M + H] + adduct, retention time (RT) 9.60 min), which is significantly increased in the patient sample compared with 27 controls (fold change 52.8). b 3-Hydroxy-3-methylglutaryl CoA-lyase deficiency: data shown for 3-hydroxyisovaleric acid, m/z 117.0557 ([M − H]  adduct, RT 3.43 min), which is significantly increased in the patient sample compared with 28 controls (fold change 28.1). c Adenylosuccinate lyase deficiency: data shown for succinyladenosine, m/z 384;1144 ([M + H]+ adduct, RT 4.71 min), which is significantly increased in the patient sample compared with 29 controls (fold change 264.6). d Ornithine amino transferase deficiency: data shown for ornithine, m/z 133.09714 ([M + H]+ adduct, RT 0.49 min), which is significantly increased in three patient samples compared with 27 controls (mean fold change 7.1)
Fig. 2
Fig. 2
Next-generation metabolic screening (NGMS) multistep workflow
Fig. 3
Fig. 3
Next-generation metabolic screening (NGMS) results in xanthinuria type II. Panels b–e, show the feature intensity distribution in 26 control plasma samples (X-axis represents feature peak area in arbitrary units), and should be interpreted as described in Fig. 1. Red patient values. a xanthine dehydrogenase (XDH) (a1) and aldehyde oxidase (AO) function (a2). b Xanthine, m/z 151.02624 ([M − H]  adduct), retention time (RT) 2.02, is significantly increased in the patient sample (fold change 7.2). c 5-Hydroxyisourate, m/z 183.01634 ([M − H] adduct), RT 1.47, is significantly decreased in the patient sample (fold change −15.4). d Urate, m/z 167.02137 ([M − H] adduct), RT 1.49, is virtually absent in the patient sample (fold change −810.2). b–d represent perturbations resulting from defective xanthine dehydrogenase (XDH) function (see pathway in a1). e N-1-methyl-4/2-pyridone-5-carboxamide, m/z 153.0659 ([M + H] + adduct), RT 2.95, is virtually absent in the patient sample (fold change −232.4) due to defective AO function (see pathway in a2), and results are therefore indicative of type II
Fig. 4
Fig. 4
Next-generation metabolic screening (NGMS) for Canavan disease and histidinemia. In panels b, d, and e, boxplots show the feature-intensity distribution in control plasma samples (N = 27, N = 29, and N = 29, respectively; the X-axis represents feature peak area in arbitrary units) and should be interpreted as described in Fig. 1. Red patient values. a N-acetylaspartic acid metabolism: in Canavan disease, the function of aspartoacylase is deficient. b N-acetylaspartic acid [M + Na] + feature (m/z 198.03723, retention time (RT) 1.15): significantly increased in plasma (red circle, fold change 36.5). In a patient with a variant of uncertain significance (VUS) in the Canavan-associated ASPA gene (red triangle), this feature was not significantly altered (fold change 4.6). c Histidine metabolism: in histidinemia, the function of histidine ammonia lyase is deficient. d Histidine, m/z 154.06247 ([M − H]  adduct), RT 0.60, is significantly increased in the patient sample (fold change 6.9). e A feature with m/z 157.06074 and RT 0.71: significantly increased in the patient sample (fold change 13.6); this feature putatively represents the [M + H] + adduct of imidazole lactic acid, which is derived from metabolism of accumulating histidine, as depicted in c

References

    1. Abela L, Simmons L, Steindl K, et al. N-8-acetylspermidine as a potential plasma biomarker for Snyder-Robinson syndrome identified by clinical metabolomics. J Inherit Metab Dis. 2016;39(1):131–137. doi: 10.1007/s10545-015-9876-y. - DOI - PubMed
    1. Abela L, Spiegel R, Crowther LM, et al. Plasma metabolomics reveals a diagnostic metabolic fingerprint for mitochondrial aconitase (ACO2) deficiency. PLoS One. 2017;12(5):e0176363. doi: 10.1371/journal.pone.0176363. - DOI - PMC - PubMed
    1. Benjamini Y, Hochberg Y. Controlling the false discovery rate - a practical and powerful approach to multiple testing. J R Stat Soc Ser B Methodol. 1995;57(1):289–300.
    1. Cuykx M, Negreira N, Beirnaert C, et al. Tailored liquid chromatography-mass spectrometry analysis improves the coverage of the intracellular metabolome of HepaRG cells. J Chromatogr A. 2017;1487:168–178. doi: 10.1016/j.chroma.2017.01.050. - DOI - PubMed
    1. Denes J, Szabo E, Robinette SL, et al. Metabonomics of newborn screening dried blood spot samples: a novel approach in the screening and diagnostics of inborn errors of metabolism. Anal Chem. 2012;84(22):10113–10120. doi: 10.1021/ac302527m. - DOI - PubMed

MeSH terms