

Amyloid-beta 1-40 is associated with alterations in NG2+ pericyte population ex vivo and in vitro
- PMID: 29453790
- PMCID: PMC5946076
- DOI: 10.1111/acel.12728
Amyloid-beta 1-40 is associated with alterations in NG2+ pericyte population ex vivo and in vitro
Abstract
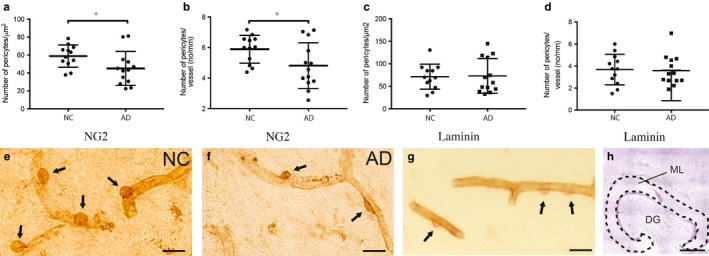
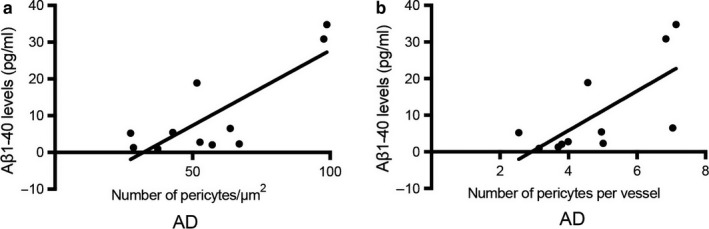
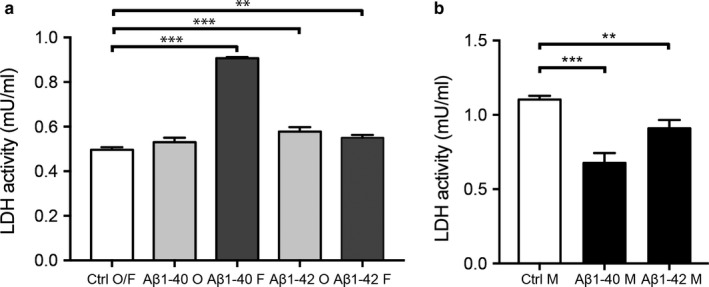
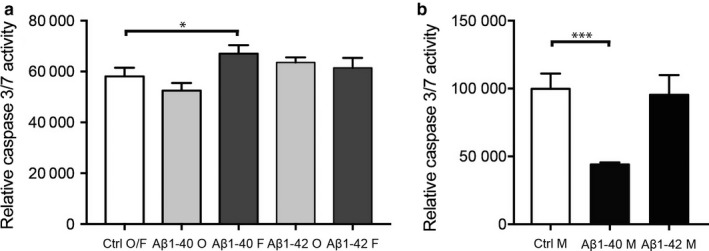
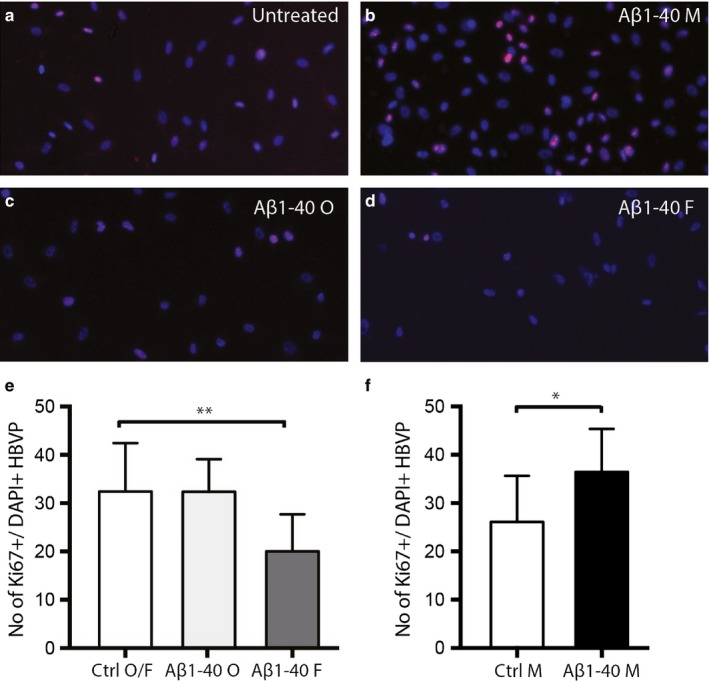
The population of brain pericytes, a cell type important for vessel stability and blood brain barrier function, has recently been shown altered in patients with Alzheimer's disease (AD). The underlying reason for this alteration is not fully understood, but progressive accumulation of the AD characteristic peptide amyloid-beta (Aβ) has been suggested as a potential culprit. In the current study, we show reduced number of hippocampal NG2+ pericytes and an association between NG2+ pericyte numbers and Aβ1-40 levels in AD patients. We further demonstrate, using in vitro studies, an aggregation-dependent impact of Aβ1-40 on human NG2+ pericytes. Fibril-EP Aβ1-40 exposure reduced pericyte viability and proliferation and increased caspase 3/7 activity. Monomer Aβ1-40 had quite the opposite effect: increased pericyte viability and proliferation and reduced caspase 3/7 activity. Oligomer-EP Aβ1-40 had no impact on either of the cellular events. Our findings add to the growing number of studies suggesting a significant impact on pericytes in the brains of AD patients and suggest different aggregation forms of Aβ1-40 as potential key regulators of the brain pericyte population size.
Keywords: Alzheimer's disease; amyloid-beta 1-40; hippocampus; pericytes.
© 2018 The Authors. Aging Cell published by the Anatomical Society and John Wiley & Sons Ltd.
Figures
Similar articles
-
Involvement of matrix metalloproteinase-9 in amyloid-β 1-42-induced shedding of the pericyte proteoglycan NG2.J Neuropathol Exp Neurol. 2014 Jul;73(7):684-92. doi: 10.1097/NEN.0000000000000084. J Neuropathol Exp Neurol. 2014. PMID: 24918635 Free PMC article.
-
NG2 cells, a new trail for Alzheimer's disease mechanisms?Acta Neuropathol Commun. 2013 May 9;1(1):7. doi: 10.1186/2051-5960-1-7. Acta Neuropathol Commun. 2013. PMID: 24252600 Free PMC article.
-
Amylin alters human brain pericyte viability and NG2 expression.J Cereb Blood Flow Metab. 2017 Apr;37(4):1470-1482. doi: 10.1177/0271678X16657093. Epub 2016 Jan 1. J Cereb Blood Flow Metab. 2017. PMID: 27354094 Free PMC article.
-
Interactions between Beta-Amyloid and Pericytes in Alzheimer's Disease.Front Biosci (Landmark Ed). 2024 Apr 2;29(4):136. doi: 10.31083/j.fbl2904136. Front Biosci (Landmark Ed). 2024. PMID: 38682184 Review.
-
The NG2 Proteoglycan in Pericyte Biology.Adv Exp Med Biol. 2018;1109:5-19. doi: 10.1007/978-3-030-02601-1_2. Adv Exp Med Biol. 2018. PMID: 30523586 Review.
Cited by
-
Understanding the Pathophysiology of Cerebral Amyloid Angiopathy.Int J Mol Sci. 2020 May 13;21(10):3435. doi: 10.3390/ijms21103435. Int J Mol Sci. 2020. PMID: 32414028 Free PMC article. Review.
-
Deep Imaging to Dissect Microvascular Contributions to White Matter Degeneration in Rodent Models of Dementia.Stroke. 2023 May;54(5):1403-1415. doi: 10.1161/STROKEAHA.122.037156. Epub 2023 Apr 24. Stroke. 2023. PMID: 37094035 Free PMC article. Review.
-
The Amyloid-Tau-Neuroinflammation Axis in the Context of Cerebral Amyloid Angiopathy.Int J Mol Sci. 2019 Dec 14;20(24):6319. doi: 10.3390/ijms20246319. Int J Mol Sci. 2019. PMID: 31847365 Free PMC article. Review.
-
Chondroitin Sulphate Proteoglycan Axonal Coats in the Human Mediodorsal Thalamic Nucleus.Front Integr Neurosci. 2022 Jul 6;16:934764. doi: 10.3389/fnint.2022.934764. eCollection 2022. Front Integr Neurosci. 2022. PMID: 35875507 Free PMC article.
-
Vascular Dysfunction in Alzheimer's Disease: A Prelude to the Pathological Process or a Consequence of It?J Clin Med. 2019 May 10;8(5):651. doi: 10.3390/jcm8050651. J Clin Med. 2019. PMID: 31083442 Free PMC article. Review.
References
-
- Bassett, C. N. , Neely, M. D. , Sidell, K. R. , Markesbery, W. R. , Swift, L. L. , & Montine, T. J. (1999). Cerebrospinal fluid lipoproteins are more vulnerable to oxidation in Alzheimer's disease and are neurotoxic when oxidized ex vivo. Lipids, 34, 1273–1280. 10.1007/s11745-999-0478-1 - DOI - PubMed
Publication types
MeSH terms
Substances
LinkOut - more resources
Full Text Sources
Other Literature Sources
Research Materials
