. 2018 Feb 17;17(1):/j/sagmb.2018.17.issue-1/sagmb-2017-0038/sagmb-2017-0038.xml.
doi: 10.1515/sagmb-2017-0038.

Ensemble survival tree models to reveal pairwise interactions of variables with time-to-events outcomes in low-dimensional setting

Affiliations

Ensemble survival tree models to reveal pairwise interactions of variables with time-to-events outcomes in low-dimensional setting

Jean-Eudes Dazard et al. Stat Appl Genet Mol Biol. .

Abstract

Unraveling interactions among variables such as genetic, clinical, demographic and environmental factors is essential to understand the development of common and complex diseases. To increase the power to detect such variables interactions associated with clinical time-to-events outcomes, we borrowed established concepts from random survival forest (RSF) models. We introduce a novel RSF-based pairwise interaction estimator and derive a randomization method with bootstrap confidence intervals for inferring interaction significance. Using various linear and nonlinear time-to-events survival models in simulation studies, we first show the efficiency of our approach: true pairwise interaction-effects between variables are uncovered, while they may not be accompanied with their corresponding main-effects, and may not be detected by standard semi-parametric regression modeling and test statistics used in survival analysis. Moreover, using a RSF-based cross-validation scheme for generating prediction estimators, we show that informative predictors may be inferred. We applied our approach to an HIV cohort study recording key host gene polymorphisms and their association with HIV change of tropism or AIDS progression. Altogether, this shows how linear or nonlinear pairwise statistical interactions of variables may be efficiently detected with a predictive value in observational studies with time-to-event outcomes.

Keywords: epistasis; genetic variations interactions; interaction detection and modeling; random survival forest; time-to-event analysis.


Conflict of interest statement

Conflict of interest: The authors do not have a commercial or other association that might pose a conflict of interest.

Figures

Figure 1
Figure 1
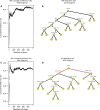
RSF global prediction performance and visualization of RSF illustrative tree in simulated data. (A) Left: forest-averaged RSF cumulative OOB error rate for the ensemble as a function of number of trees. (B) Visualization of an exemplary tree (e.g. #2) out of the B = 1000 trees of the RSF forest. Result shown is for the linear latent variable survival model (LLV), with continuous variables, and fixed censoring rate (ρ = 0.5), in regression model #5 (positive control), where a single arbitrarily fixed 2nd-order term enter in the model, simulated from two arbitrarily-fixed variables (e.g. here {j = 1, k = 2}, i.e. for x1x2 – see Section 3). Note how the cumulative OOB error rate stabilizes rapidly as a function of the number of trees (at 8.46%), indicating that a forest of B = 1000 trees was sufficient with an average number of terminal nodes of 66.29. Yellow-colored nodes represent individual variables. The depth of the trees is indicated by numbers (0–15) inside of each node (0 being the root node). Each tree illustrates one possible ranking of variable importance (height vs. depth of the nodes) and variable interactions (edges between nodes in the same branch). In this example, note how top interactions involving a root node x1 with a child node x2 are detected by IMDMS bivariate RSF statistic (highlighted red edges). Also, note the proportion of true interactions x1x2 involving a parent node x1 with a child node x2 out of all top detected ones (5/7) from root to depth #3 (highlighted red branches).
Figure 2
Figure 2
Scatter plots of IMDMS bivariate RSF statistics for the detection of interaction-effects in negative and positive controls of simulated data. Results shown are for the linear latent variable survival model (LLV), with continuous variables, and fixed censoring rate (ρ = 0.5), in null regression model #1 (negative control), where no terms enter in the models, and in regression model #5 (positive control), where a single arbitrarily-fixed 2nd-order term enter in the model, simulated from two arbitrarily-fixed variables (e.g. here {j = 1, k = 2}, i.e. for x1x2 – see Section 3). (A) Left: RSF results in null regression model #1. (B) Right: RSF results in regression model #5. (A, B) For each model and each variable pair xj and xk, j, k ∈ {1, …, p}, j < k (i.e. 10 pairs, for p = 5), the IMDMS bivariate RSF statistic mean (Ψ̂(j, k) or IMDMS) is plotted against its noised-up counterpart (Ψ̂* (j, k) or Noise IMDMS*). RSF statistic means (diamonds) are numbered by order of decreasing significance. Blue or red color denotes pairs of variable with a significant or non-significant measure of IMDMS at the θ = 0.05 level, respectively. Pairs of variables with significant measures of interaction have confidence intervals on both axes (dotted boxes) farther above and left of the identity line (dashed line) without crossing it. Note the accuracy of inferences by IMDMS decision rule: IMDMS correctly does not detect any variables interaction-effects in the case of negative control regression model, and correctly detects the single true variables interaction-effect x1x2 (and only it) in the case of positive control regression model (see also Table 1 and Table 2).
Figure 3
Figure 3
RSF Global Prediction Performance and Visualization of RSF Illustrative Tree in Both Outcomes of the MACS Cohort Study (A, B) Left: forest-averaged RSF cumulative OOB error rates for the ensemble as a function of number of trees. (C, D) Visualization of an exemplary tree (e.g. #38, C; e.g. #11, D) out of the B = 1000 trees of the RSF forests for the time-to-X4-Emergence (C) and time-to-AIDS-Diagnosis (D) outcomes, respectively. Note how cumulative OOB error rates stabilize rapidly as a function of the number of trees (at 50.53% and 32.32%), indicating that a forest of B = 1000 trees was sufficient for both outcomes with an average number of terminal nodes of 14.2 and 14.5 for the X4-Emergence and AIDS-Diagnosis outcomes, respectively. Yellow-colored nodes represent individual variables. The depth of the trees is indicated by numbers (0–6) inside of each node (0 being the root node). Each tree illustrates one possible ranking of variable importance (height vs. depth of the nodes) and variable interactions (edges between nodes in the same branch). In this example, note how top interactions involving root node Group with a child node of another genetic variant are detected by IMDMS bivariate RSF statistic (highlighted red edges).
Figure 4
Figure 4
Scatter plots of IMDMS bivariate RSF statistics for the detection of interaction-effects in both outcomes of the MACS cohort study. (A) Left: RSF results for time-to-X4-Emergence outcome. (B) Right: RSF results for time-to-AIDS-Diagnosis outcome. (A, B) For each outcome and each variable pair xj and xk, for j, k ∈ {1, …, p}, j < k, the IMDMS bivariate RSF statistic mean (Ψ̂(j, k) or IMDMS) is plotted against its noised-up counterpart (Ψ̂* (j, k) or Noise IMDMS*). RSF statistic means (diamonds) are numbered by order of decreasing significance. Blue or red color denotes a significant or non-significant measure of IMDMS at the θ = 0.10 level, respectively. Pairs of variables with significant measures of interaction have confidence intervals on both axes (dotted boxes) farther above and left of the identity line (dashed line) without crossing it (see also Table 8, Table 9).

Similar articles

Cited by

References

    1. Bien J, Taylor J, Tibshirani R. A lasso for hierarchical interactions. Ann. Stat. 2013;41:1111–1141. - PMC - PubMed
    1. Breiman L. Random forests. Mach. Learn. 2001;45:5–32.
    1. Cantor RM, Lange K, Sinsheimer JS. Prioritizing GWAS results: a review of statistical methods and recommendations for their application. Am. J. Hum. Genet. 2010;86:6–22. - PMC - PubMed
    1. Chen W, Ghosh D, Raghunathan TE, Norkin M, Sargent DJ, Bepler G. On Bayesian methods of exploring qualitative interactions for targeted treatment. Stat. Med. 2012;31:3693–3707. - PMC - PubMed
    1. Chen X, Ishwaran H. Random forests for genomic data analysis. Genomics. 2012;99:323–329. - PMC - PubMed

Publication types