. 2018 Mar 15:343:71-83.
doi: 10.1016/j.taap.2018.02.006. Epub 2018 Feb 14.

AOP-DB: A database resource for the exploration of Adverse Outcome Pathways through integrated association networks

Affiliations

AOP-DB: A database resource for the exploration of Adverse Outcome Pathways through integrated association networks

Maureen E Pittman et al. Toxicol Appl Pharmacol. .

Abstract

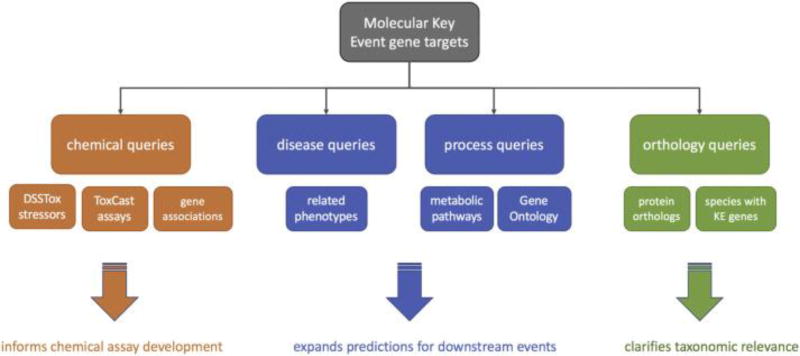
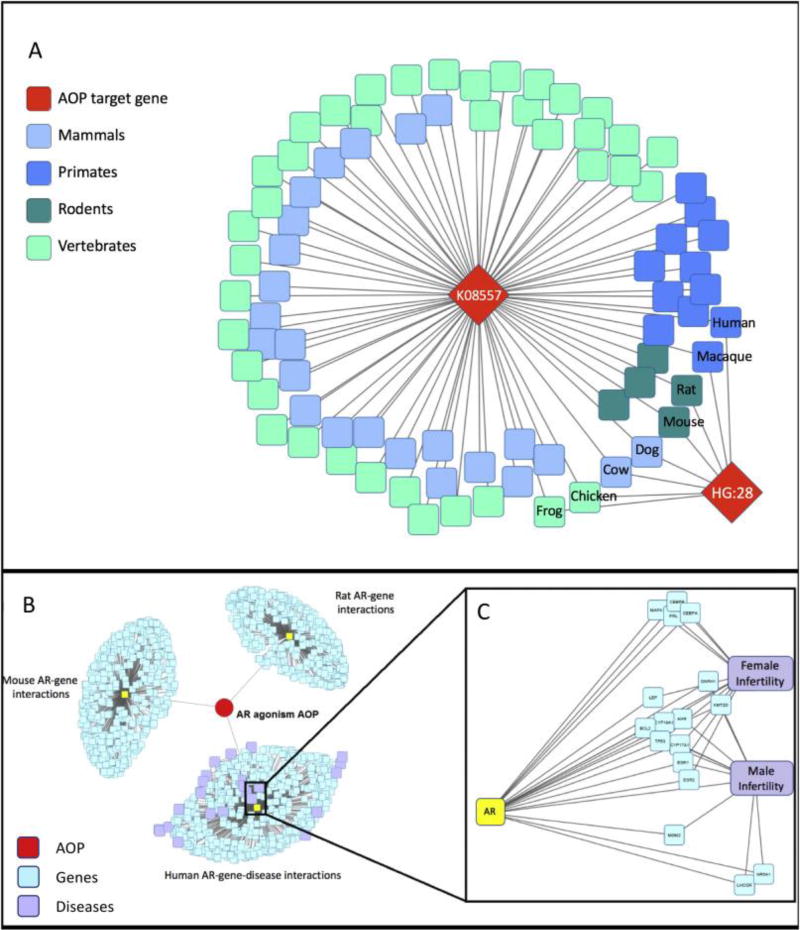
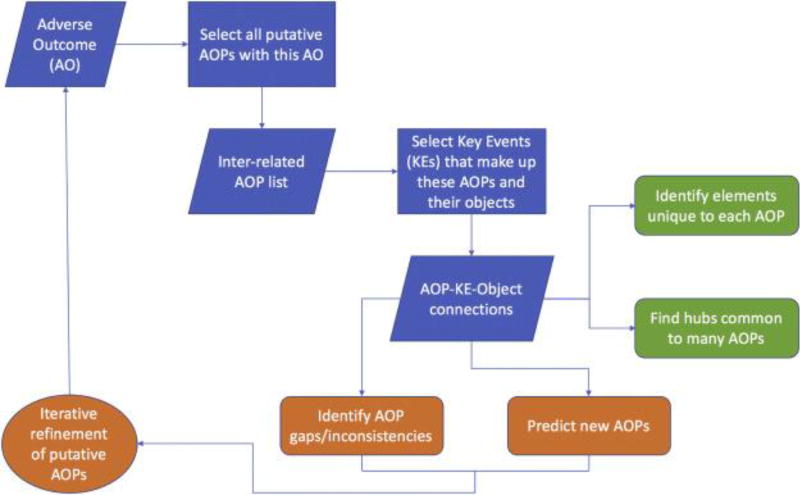
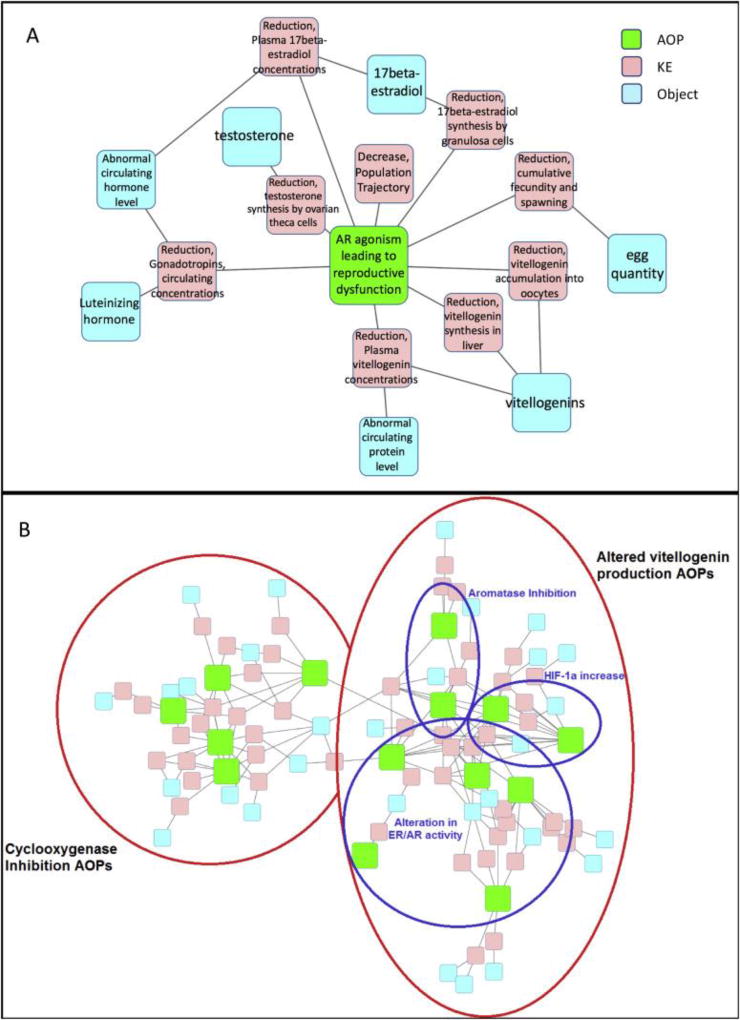
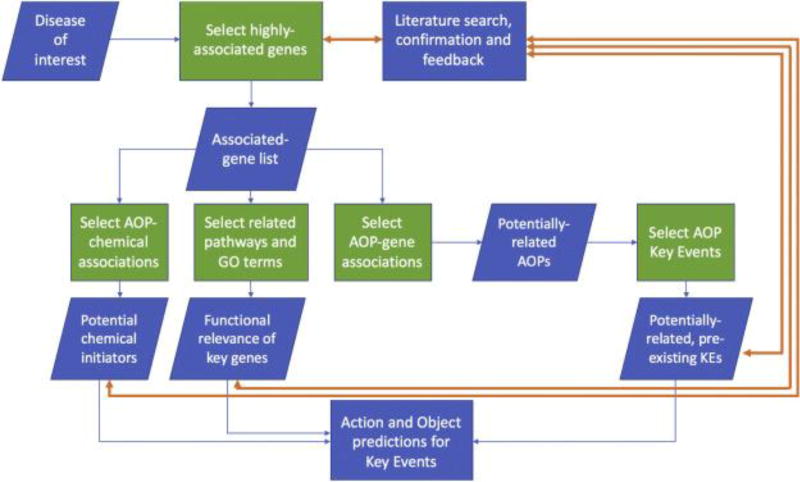
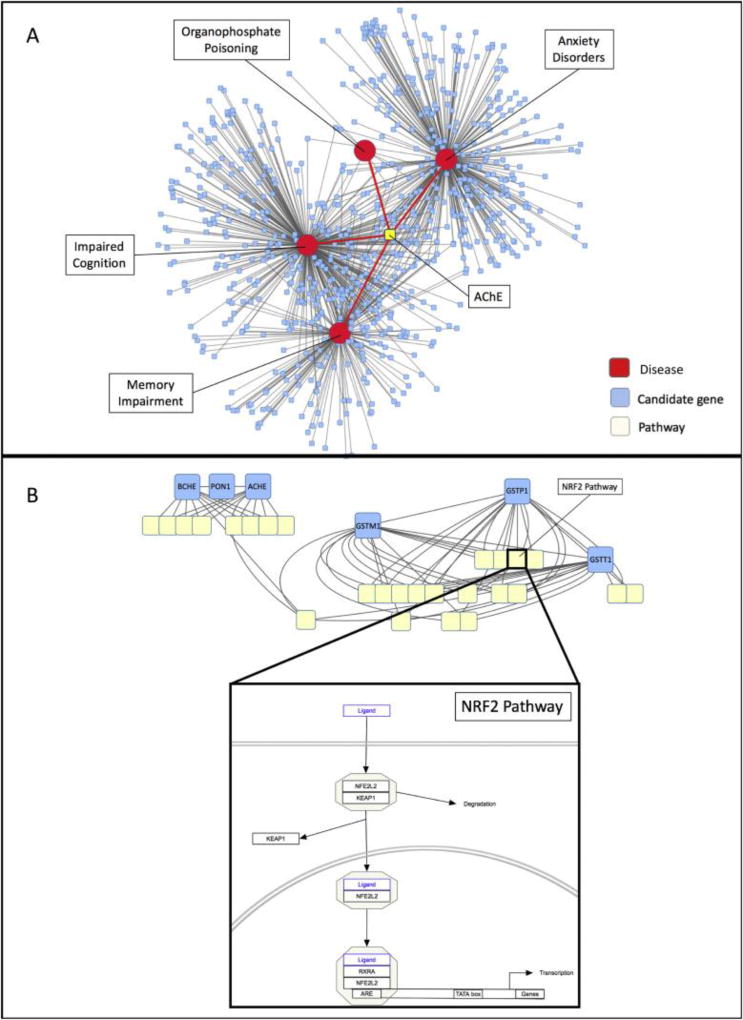
The Adverse Outcome Pathway (AOP) framework describes the progression of a toxicity pathway from molecular perturbation to population-level outcome in a series of measurable, mechanistic responses. The controlled, computer-readable vocabulary that defines an AOP has the ability to, automatically and on a large scale, integrate AOP knowledge with publically available sources of biological high-throughput data and its derived associations. To support the discovery and development of putative (existing) and potential AOPs, we introduce the AOP-DB, an exploratory database resource that aggregates association relationships between genes and their related chemicals, diseases, pathways, species orthology information, ontologies, and gene interactions. These associations are mined from publically available annotation databases and are integrated with the AOP information centralized in the AOP-Wiki, allowing for the automatic characterization of both putative and potential AOPs in the context of multiple areas of biological information, referred to here as "biological entities". The AOP-DB acts as a hypothesis-generation tool for the expansion of putative AOPs, as well as the characterization of potential AOPs, through the creation of association networks across these biological entities. Finally, the AOP-DB provides a useful interface between the AOP framework and existing chemical screening and prioritization efforts by the US Environmental Protection Agency.

Keywords: Adverse Outcome Pathways (AOPs); Association networks; Data integration; Data mining; Database; Risk assessment.


Figures

Figure 1
Figure 1
Visualizations for AR agonism gene association data. 1A: Flowchart depicting the nature of potential lines of inquiry and their application. Queries constructed to examine the chemicals, diseases, functional processes, and species applicability of Key Evene genes are applied to assay development and prioritization efforts. 1B: The red diamond-shaped nodes represent the two orthology groups for the AR gene (ko:K08557 sourced from KEGG Orthology; HG:28 sourced from NCBI HomoloGene). Both of these sources recognize the model organisms H. sapiens, M. mulatta, M. musculus, R. norvegicus, C. lupus familiaris, B. taurus, X. tropicalis, and G. gallus as possessing orthologs for this gene. KEGG recognizes an additional 76 vertebrates with this gene. 1C: AR gene clustering based on STRING protein interaction confidence scores (visual cutoff = 0.5), and DisGeNET disease associations with those genes (visual cutoff = 0.1). The red circle and its edges represent the AR agonism AOP and its direct gene associations. The three large clusters represent the three taxa whose AOPwiki object IDs were associated with the AR gene identifier (in yellow): Human, Mouse, and Rat. Genes that are highly associated with AR (shown in blue) are clustered based on interaction confidence score. The human cluster (bottom) also shows gene-disease relationships for these closely-associated genes, with diseases represented by purple nodes. 1D: A subset of Network 1C, showing the genes that were both highly associated with the AR gene AND highly associated with the diseases “Female infertility” and “Male infertility”.
Figure 1
Figure 1
Visualizations for AR agonism gene association data. 1A: Flowchart depicting the nature of potential lines of inquiry and their application. Queries constructed to examine the chemicals, diseases, functional processes, and species applicability of Key Evene genes are applied to assay development and prioritization efforts. 1B: The red diamond-shaped nodes represent the two orthology groups for the AR gene (ko:K08557 sourced from KEGG Orthology; HG:28 sourced from NCBI HomoloGene). Both of these sources recognize the model organisms H. sapiens, M. mulatta, M. musculus, R. norvegicus, C. lupus familiaris, B. taurus, X. tropicalis, and G. gallus as possessing orthologs for this gene. KEGG recognizes an additional 76 vertebrates with this gene. 1C: AR gene clustering based on STRING protein interaction confidence scores (visual cutoff = 0.5), and DisGeNET disease associations with those genes (visual cutoff = 0.1). The red circle and its edges represent the AR agonism AOP and its direct gene associations. The three large clusters represent the three taxa whose AOPwiki object IDs were associated with the AR gene identifier (in yellow): Human, Mouse, and Rat. Genes that are highly associated with AR (shown in blue) are clustered based on interaction confidence score. The human cluster (bottom) also shows gene-disease relationships for these closely-associated genes, with diseases represented by purple nodes. 1D: A subset of Network 1C, showing the genes that were both highly associated with the AR gene AND highly associated with the diseases “Female infertility” and “Male infertility”.
Figure 2
Figure 2
Visual diagrams to show the relationships between AOPs, constituent KEs, and the objects upon which they act. 2A: Flowchart depicting the series of queries made to the AOP-DB to characterize the concordance and divergence between groups of AOPs. 2B: KE and object relationships for the AR agonism AOP alone, with the AOP shown in green, KE nodes shown in pink, and object nodes in blue. 2C: KE and object relationships for all “Reproductive Dysfunction” AOPs. The red circles represent the two major classes of reproductive dysfunction AOPs: Cyclooxygenase Inhibition AOPs (left), and altered Vitellogenin (VTG) production AOPs (right). Within the altered VTG class, there are three sub-classes of AOP types: those resulting from alteration in hormone receptor activity, those stemming from aromatase inhibition, and those resulting from an increase in HIF-1α concentration (demarcated by blue circles).
Figure 2
Figure 2
Visual diagrams to show the relationships between AOPs, constituent KEs, and the objects upon which they act. 2A: Flowchart depicting the series of queries made to the AOP-DB to characterize the concordance and divergence between groups of AOPs. 2B: KE and object relationships for the AR agonism AOP alone, with the AOP shown in green, KE nodes shown in pink, and object nodes in blue. 2C: KE and object relationships for all “Reproductive Dysfunction” AOPs. The red circles represent the two major classes of reproductive dysfunction AOPs: Cyclooxygenase Inhibition AOPs (left), and altered Vitellogenin (VTG) production AOPs (right). Within the altered VTG class, there are three sub-classes of AOP types: those resulting from alteration in hormone receptor activity, those stemming from aromatase inhibition, and those resulting from an increase in HIF-1α concentration (demarcated by blue circles).
Figure 3
Figure 3
Cytoscape visualizations for a proposed AOP, “acetylcholinesterase inhibition leading to neuropsychological dysfunction”. 3A: Flowchart depicting the series of steps taken to develop a predicted AOP from the AOP-DB. 3B: Four selected disease outcomes and their associated genes, clustered by gene interaction scores. Red nodes represent the diseases of interest, and blue nodes represent associated genes, clustered by association confidence score. 3C: Pathway membership for candidate genes in the predicted AOP “ACHE Inhibition leading to neuropsychological dysfunction.” Red nodes represent diseases of interest. Blue nodes represent the candidate genes associated with Organophosphate Poisoning and at least one of Anxiety Disorders, Memory Impairment, and Impaired Cognition. Each yellow node represents a pathway in which the indicated genes are active. 3D: Orthology confidence scores for gene candidates. The large light blue nodes are labelled with the identity of the gene candidate, and edges connect nodes of gene orthologs for different species based on confidence score. Edges connecting different genes (e.g. ACHE and BCHE genes) indicate paralogs (genes evolved after a duplication event).
Figure 3
Figure 3
Cytoscape visualizations for a proposed AOP, “acetylcholinesterase inhibition leading to neuropsychological dysfunction”. 3A: Flowchart depicting the series of steps taken to develop a predicted AOP from the AOP-DB. 3B: Four selected disease outcomes and their associated genes, clustered by gene interaction scores. Red nodes represent the diseases of interest, and blue nodes represent associated genes, clustered by association confidence score. 3C: Pathway membership for candidate genes in the predicted AOP “ACHE Inhibition leading to neuropsychological dysfunction.” Red nodes represent diseases of interest. Blue nodes represent the candidate genes associated with Organophosphate Poisoning and at least one of Anxiety Disorders, Memory Impairment, and Impaired Cognition. Each yellow node represents a pathway in which the indicated genes are active. 3D: Orthology confidence scores for gene candidates. The large light blue nodes are labelled with the identity of the gene candidate, and edges connect nodes of gene orthologs for different species based on confidence score. Edges connecting different genes (e.g. ACHE and BCHE genes) indicate paralogs (genes evolved after a duplication event).

References

    1. Ahmed GM, Davies DR. Chronic organophosphate exposure: toward the definition of a neuropsychiatric syndrome. Journal of Nutritional and Environmental Medicine. 2009;7:169–176. doi: 10.1080/13590849762583. - DOI
    1. Ankley GT, Bennett RS, Erickson RJ, Hoff DJ, Hornung MW, Johnson RD, Villeneuve DL. Adverse outcome pathways: a conceptual framework to support ecotoxicology research and risk assessment. Environ Toxicol Chem. 2010;29(3):730–741. doi: 10.1002/etc.34. - DOI - PubMed
    1. Ankley GT, Jensen KM, Makynen EA, Kahl MD, Korte JJ, Hornung MW, Gray LE. Effects of the androgenic growth promoter 17-beta-trenbolone on fecundity and reproductive endocrinology of the fathead minnow. Environ Toxicol Chem. 2003;22(6):1350–1360. - PubMed
    1. Arun M, Palimar V. Neurological manifestations in Organophosphorous toxicity. Journal of Indian Academic Forensic Medicine. 2005;30:29–31.
    1. Ashburner M, Ball CA, Blake JA, Botstein D, Butler H, Cherry JM, Sherlock G. Gene ontology: tool for the unification of biology. The Gene Ontology Consortium. Nat Genet. 2000;25(1):25–29. doi: 10.1038/75556. - DOI - PMC - PubMed

Publication types

MeSH terms