

Assessing the repeatability of absolute CMRO2, OEF and haemodynamic measurements from calibrated fMRI
- PMID: 29454105
- PMCID: PMC6503182
- DOI: 10.1016/j.neuroimage.2018.02.020
Assessing the repeatability of absolute CMRO2, OEF and haemodynamic measurements from calibrated fMRI
Abstract
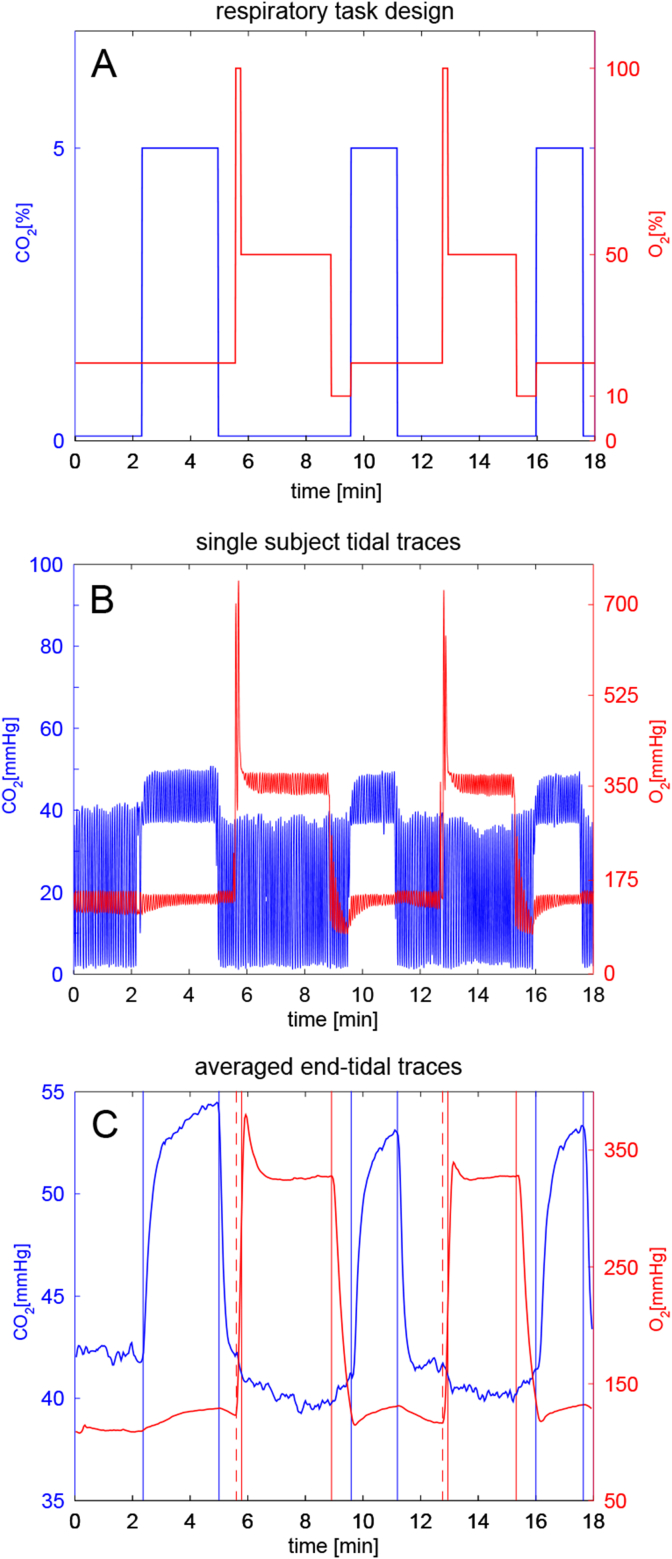
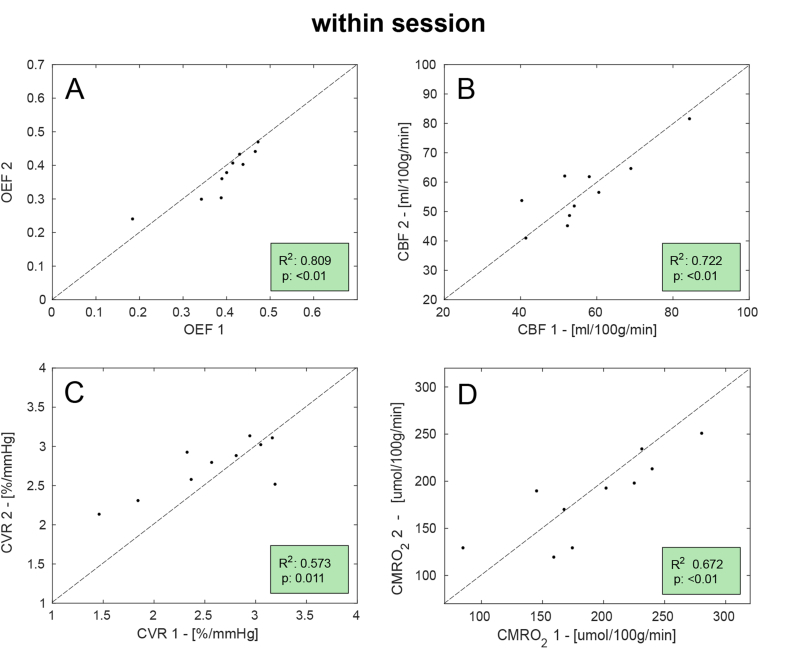
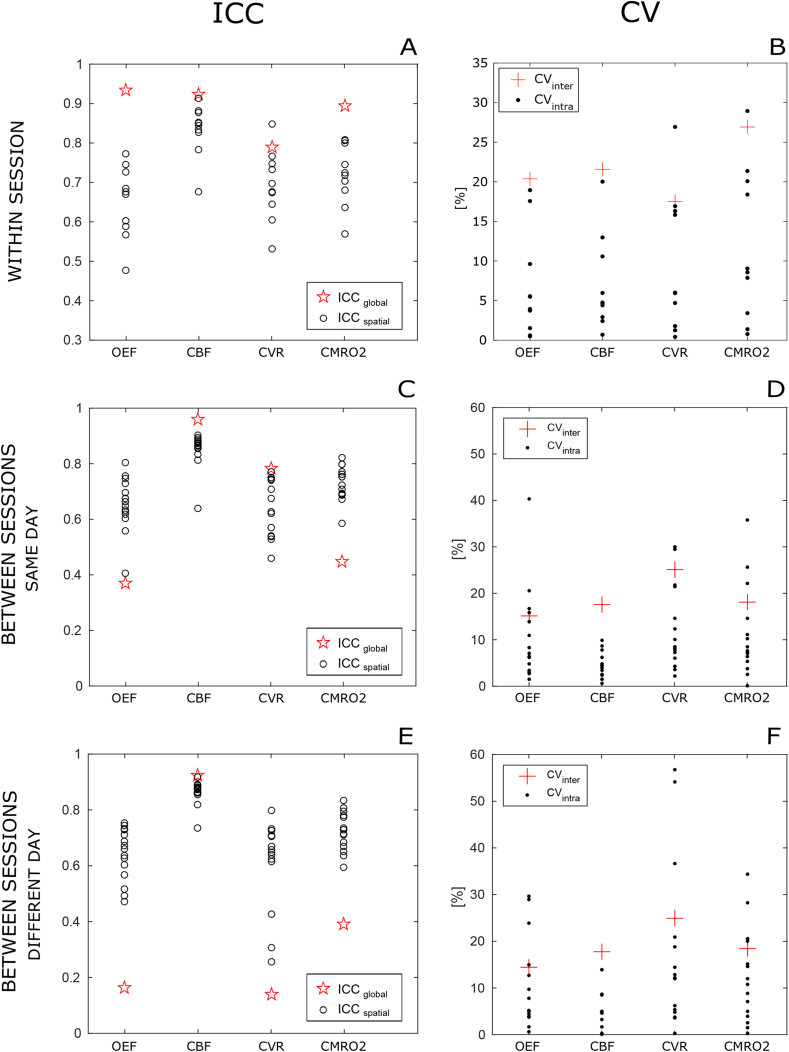
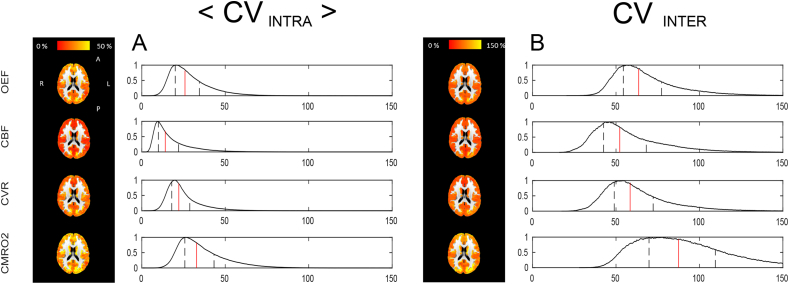
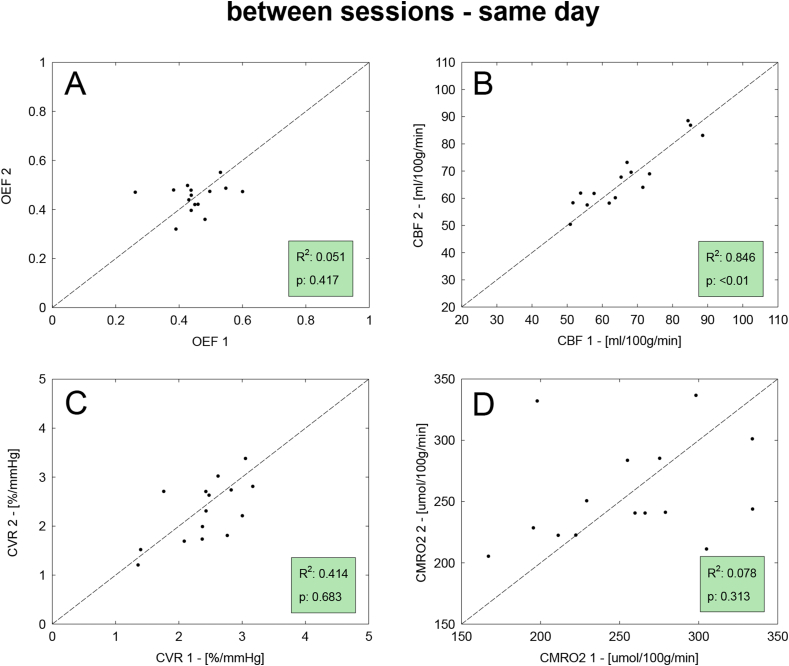
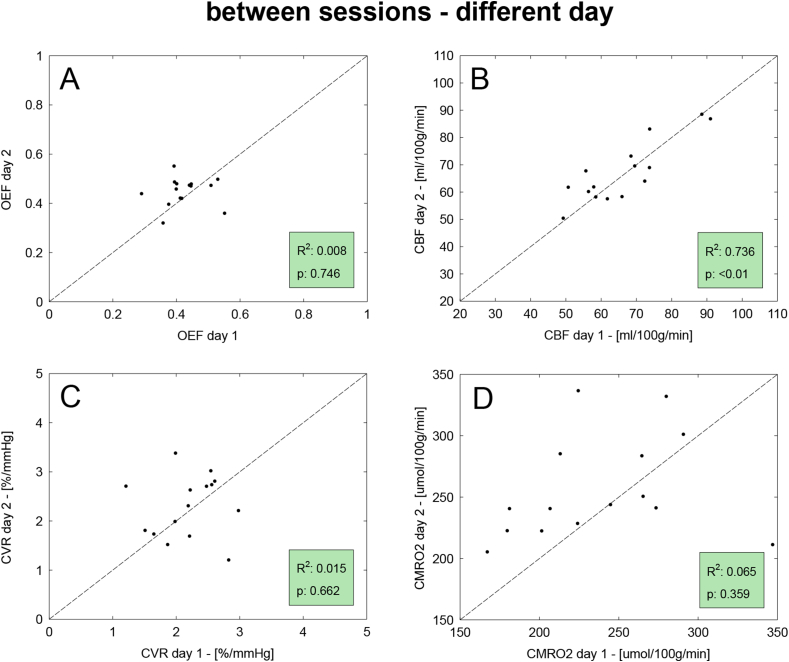
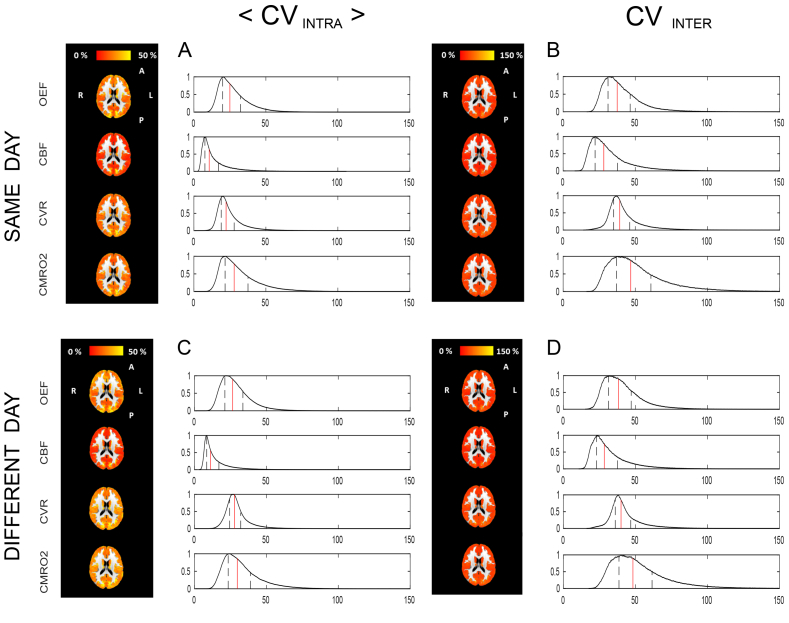
As energy metabolism in the brain is largely oxidative, the measurement of cerebral metabolic rate of oxygen consumption (CMRO2) is a desirable biomarker for quantifying brain activity and tissue viability. Currently, PET techniques based on oxygen isotopes are the gold standard for obtaining whole brain CMRO2 maps. Among MRI techniques that have been developed as an alternative are dual calibrated fMRI (dcFMRI) methods, which exploit simultaneous measurements of BOLD and ASL signals during a hypercapnic-hyperoxic experiment to modulate brain blood flow and oxygenation. In this study we quantified the repeatability of a dcFMRI approach developed in our lab, evaluating its limits and informing its application in studies aimed at characterising the metabolic state of human brain tissue over time. Our analysis focussed on the estimates of oxygen extraction fraction (OEF), cerebral blood flow (CBF), CBF-related cerebrovascular reactivity (CVR) and CMRO2 based on a forward model that describes analytically the acquired dual echo GRE signal. Indices of within- and between-session repeatability are calculated from two different datasets both at a bulk grey matter and at a voxel-wise resolution and finally compared with similar indices obtained from previous MRI and PET measurements. Within- and between-session values of intra-subject coefficient of variation (CVintra) calculated from bulk grey matter estimates 6.7 ± 6.6% (mean ± std.) and 10.5 ± 9.7% for OEF, 6.9 ± 6% and 5.5 ± 4.7% for CBF, 12 ± 9.7% and 12.3 ± 10% for CMRO2. Coefficient of variation (CV) and intraclass correlation coefficient (ICC) maps showed the spatial distribution of the repeatability metrics, informing on the feasibility limits of the method. In conclusion, results show an overall consistency of the estimated physiological parameters with literature reports and a satisfactory level of repeatability considering the higher spatial sensitivity compared to other MRI methods, with varied performance depending on the specific parameter under analysis, on the spatial resolution considered and on the study design.
Copyright © 2018 The Authors. Published by Elsevier Inc. All rights reserved.
Figures

Similar articles
-
Mapping the pharmacological modulation of brain oxygen metabolism: The effects of caffeine on absolute CMRO2 measured using dual calibrated fMRI.Neuroimage. 2017 Jul 15;155:331-343. doi: 10.1016/j.neuroimage.2017.03.028. Epub 2017 Mar 18. Neuroimage. 2017. PMID: 28323164 Free PMC article. Clinical Trial.
-
Measurement of OEF and absolute CMRO2: MRI-based methods using interleaved and combined hypercapnia and hyperoxia.Neuroimage. 2013 Dec;83:135-47. doi: 10.1016/j.neuroimage.2013.06.008. Epub 2013 Jun 13. Neuroimage. 2013. PMID: 23769703 Free PMC article. Clinical Trial.
-
Regional Reproducibility of BOLD Calibration Parameter M, OEF and Resting-State CMRO2 Measurements with QUO2 MRI.PLoS One. 2016 Sep 20;11(9):e0163071. doi: 10.1371/journal.pone.0163071. eCollection 2016. PLoS One. 2016. PMID: 27649493 Free PMC article.
-
Non-BOLD contrast for laminar fMRI in humans: CBF, CBV, and CMRO2.Neuroimage. 2019 Aug 15;197:742-760. doi: 10.1016/j.neuroimage.2017.07.041. Epub 2017 Jul 20. Neuroimage. 2019. PMID: 28736310 Review.
-
Physiology of functional magnetic resonance imaging: energetics and function.Methods Mol Med. 2006;124:175-95. doi: 10.1385/1-59745-010-3:175. Methods Mol Med. 2006. PMID: 16506422 Review.
Cited by
-
Cerebral oxygen metabolism in adults with sickle cell disease.Am J Hematol. 2020 Apr;95(4):401-412. doi: 10.1002/ajh.25727. Epub 2020 Jan 28. Am J Hematol. 2020. PMID: 31919876 Free PMC article. Clinical Trial.
-
Cerebrovascular reactivity measurements using 3T BOLD MRI and a fixed inhaled CO2 gas challenge: Repeatability and impact of processing strategy.Front Physiol. 2023 Feb 6;14:1070233. doi: 10.3389/fphys.2023.1070233. eCollection 2023. Front Physiol. 2023. PMID: 36814481 Free PMC article.
-
Cerebral oxygen extraction fraction MRI: Techniques and applications.Magn Reson Med. 2022 Aug;88(2):575-600. doi: 10.1002/mrm.29272. Epub 2022 May 5. Magn Reson Med. 2022. PMID: 35510696 Free PMC article. Review.
-
Reduced brain oxygen metabolism in patients with multiple sclerosis: Evidence from dual-calibrated functional MRI.J Cereb Blood Flow Metab. 2023 Jan;43(1):115-128. doi: 10.1177/0271678X221121849. Epub 2022 Sep 7. J Cereb Blood Flow Metab. 2023. PMID: 36071645 Free PMC article.
-
Changes in volumetric and metabolic parameters relate to differences in exposure to sub-concussive head impacts.J Cereb Blood Flow Metab. 2020 Jul;40(7):1453-1467. doi: 10.1177/0271678X19862861. Epub 2019 Jul 15. J Cereb Blood Flow Metab. 2020. PMID: 31307284 Free PMC article.
References
-
- Andersson J.L.R., Jenkinson M., Smith S.M. vol. 22. 2007. (Non-linear Registration Aka Spatial Normalisation FMRIB Technial Report TR07JA2). In Pract.
-
- Blockley N.P., Griffeth V.E.M., Stone A.J., Hare H.V., Bulte D.P. Sources of systematic error in calibrated BOLD based mapping of baseline oxygen extraction fraction. Neuroimage. 2015;122:105–113. - PubMed
Publication types
MeSH terms
Grants and funding
LinkOut - more resources
Full Text Sources
Other Literature Sources
Medical
Research Materials
Miscellaneous
