

In vitro and in silico validation of CA3 and FHL1 downregulation in oral cancer
- PMID: 29454310
- PMCID: PMC5816396
- DOI: 10.1186/s12885-018-4077-3
In vitro and in silico validation of CA3 and FHL1 downregulation in oral cancer
Abstract
Background: Aberrant methylation is a frequent event in oral cancer.
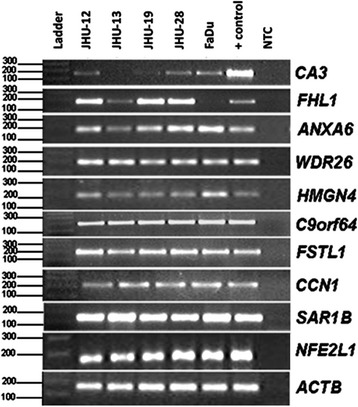
Methods: In order to better characterize these alterations, a search for genes downregulated by aberrant methylation in oral squamous cell carcinoma (OSCC) was conducted through the mining of ORESTES dataset. Findings were further validated in OSCC cell lines and patients' samples and confirmed using TCGA data. Differentially expressed genes were identified in ORESTES libraries and validated in vitro using RT-PCR in HNSCC cell-lines and OSCC tumor samples. Further confirmation of these results was performed using mRNA expression and methylation data from The Cancer Genome Atlas (TCGA) data.
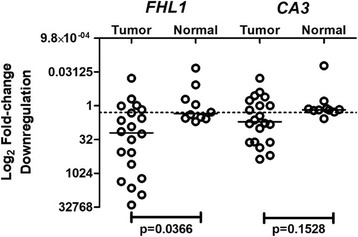
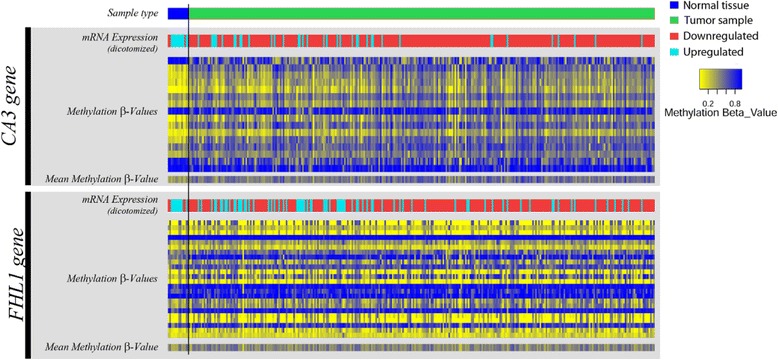
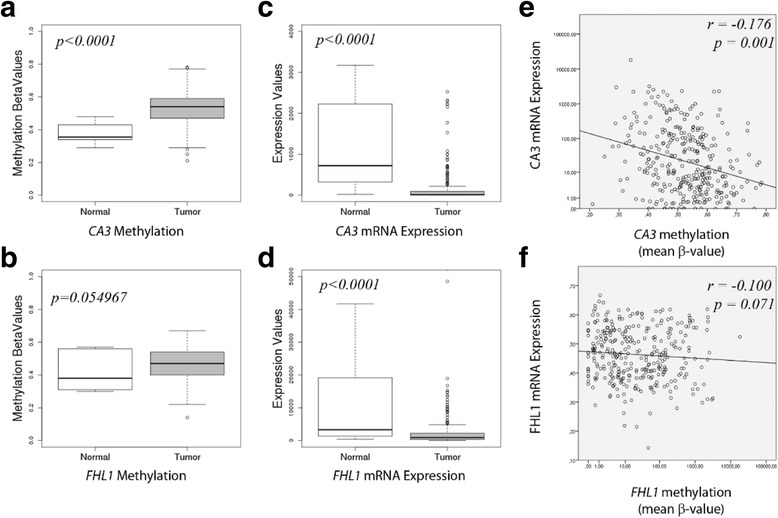
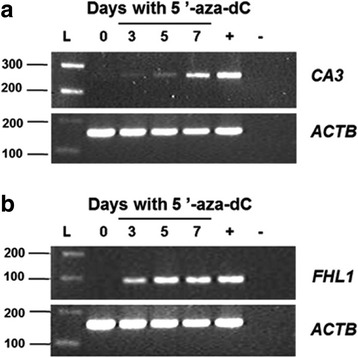
Results: From the set of genes selected for validation, CA3 and FHL1 were downregulated in 60% (12/20) and 75% (15/20) of OSCC samples, respectively, and in HNSCC cell lines. The treatment of cell lines JHU-13 and FaDu with the demethylating agent 5'-aza-dC was efficient in restoring CA3 and FHL1 expression. TCGA expression and methylation data on OSCC confirms the downregulation of these genes in OSCC samples and also suggests that expression of CA3 and FHL1 is probably regulated by methylation. The downregulation of CA3 and FHL1 observed in silico was validated in HNSCC cell lines and OSCC samples, showing the feasibility of integrating different datasets to select differentially expressed genes in silico.
Conclusions: These results showed that the downregulation of CA3 and FHL1 data observed in the ORESTES libraries was validated in HNSCC cell lines and OSCC samples and in a large cohort of samples from the TCGA database. Moreover, it suggests that expression of CA3 and FHL1 could probably be regulated by methylation having an important role the oral carcinogenesis.
Keywords: CA3; FHL1; Gene expression; Methylation; OSCC.
Conflict of interest statement
Ethics approval and consent to participate
Written informed consent was obtained from all OSCC patients and healthy donors at the time of enrollment and all aspects of this investigation were approved by the Ethics Committees A C Camargo Hospital (process number 737/05).
Consent for publication
All authors consented to publish the content within this article.
Competing interests
The authors declare that they have no competing interests.
Publisher’s Note
Springer Nature remains neutral with regard to jurisdictional claims in published maps and institutional affiliations.
Figures
Similar articles
-
Four and a half LIM domains protein 1 can be as a double-edged sword in cancer progression.Cancer Biol Med. 2020 May 15;17(2):270-281. doi: 10.20892/j.issn.2095-3941.2019.0420. Cancer Biol Med. 2020. PMID: 32587768 Free PMC article. Review.
-
High prevalence of epigenetic inactivation of the human four and a half LIM domains 1 gene in human oral cancer.Int J Oncol. 2013 Jan;42(1):141-50. doi: 10.3892/ijo.2012.1677. Epub 2012 Oct 24. Int J Oncol. 2013. PMID: 23123766
-
X-linked FHL1 as a novel therapeutic target for head and neck squamous cell carcinoma.Oncotarget. 2016 Mar 22;7(12):14537-50. doi: 10.18632/oncotarget.7478. Oncotarget. 2016. PMID: 26908444 Free PMC article.
-
Genome-wide DNA methylation profile identified a unique set of differentially methylated immune genes in oral squamous cell carcinoma patients in India.Clin Epigenetics. 2017 Feb 3;9:13. doi: 10.1186/s13148-017-0314-x. eCollection 2017. Clin Epigenetics. 2017. PMID: 28174608 Free PMC article.
-
Role of epigenetics in OSCC: an understanding above genetics.Med Oncol. 2023 Mar 20;40(4):122. doi: 10.1007/s12032-023-01992-0. Med Oncol. 2023. PMID: 36941511 Review.
Cited by
-
Role of four and a half LIM domain protein 1 in tumors (Review).Oncol Lett. 2024 Oct 29;29(1):37. doi: 10.3892/ol.2024.14783. eCollection 2025 Jan. Oncol Lett. 2024. PMID: 39512507 Free PMC article. Review.
-
Screening Differentially Expressed Proteins in Areca Nut-Related Oral Squamous Cell Carcinoma Using Tandem Mass Tag Proteomics.Int Dent J. 2025 Jun;75(3):2169-2181. doi: 10.1016/j.identj.2024.12.017. Epub 2025 Jan 4. Int Dent J. 2025. PMID: 39757032 Free PMC article.
-
FHL1 Inhibits the Progression of Colorectal Cancer by Regulating the Wnt/β-Catenin Signaling Pathway.J Cancer. 2021 Jul 3;12(17):5345-5354. doi: 10.7150/jca.60543. eCollection 2021. J Cancer. 2021. PMID: 34335951 Free PMC article.
-
MiR-96-5p Facilitates Lung Adenocarcinoma Cell Phenotypes by Inhibiting FHL1.Comput Math Methods Med. 2022 Aug 16;2022:7891222. doi: 10.1155/2022/7891222. eCollection 2022. Comput Math Methods Med. 2022. PMID: 36017148 Free PMC article.
-
Four and a half LIM domains protein 1 can be as a double-edged sword in cancer progression.Cancer Biol Med. 2020 May 15;17(2):270-281. doi: 10.20892/j.issn.2095-3941.2019.0420. Cancer Biol Med. 2020. PMID: 32587768 Free PMC article. Review.
References
-
- Barasch A, Safford M, Eisenberg E. Oral cancer and oral effects of anticancer therapy. The Mount Sinai J Med, New York. 1998;65(5–6):370–377. - PubMed
-
- Das BR, Nagpal JK. Understanding the biology of oral cancer. Medical science monitor : international medical journal of experimental and clinical research. 2002;8(11):RA258–RA267. - PubMed
-
- Sailasree R, Abhilash A, Sathyan KM, Nalinakumari KR, Thomas S, Kannan S. Differential roles of p16INK4A and p14ARF genes in prognosis of oral carcinoma. Cancer epidemiol, biomarkers & prev: a publ Am Asso Cancer Res, cosponsored by the Am Soc of Prev Oncol. 2008;17(2):414–420. doi: 10.1158/1055-9965.EPI-07-0284. - DOI - PubMed
Publication types
MeSH terms
Substances
Grants and funding
LinkOut - more resources
Full Text Sources
Other Literature Sources
Medical
Research Materials
Miscellaneous
