

Effects of a wide range of dietary forage-to-concentrate ratios on nutrient utilization and hepatic transcriptional profiles in limit-fed Holstein heifers
- PMID: 29454312
- PMCID: PMC5816523
- DOI: 10.1186/s12864-018-4529-9
Effects of a wide range of dietary forage-to-concentrate ratios on nutrient utilization and hepatic transcriptional profiles in limit-fed Holstein heifers
Abstract
Background: Improving the efficiency of animal production is a relentless pursuit of ruminant producers. Energy utilization and partition can be affected by dietary composition and nutrient availability. Furthermore, the liver is the central metabolic intersection in cattle. However, the specific metabolic changes in the liver under conditions of limit-feeding remain unclear and require further study. The present study aimed to elucidate the effects of a wide range of dietary forage:concentrate ratios (F:C) on energy utilization, and identify potential changes in molecular metabolism by analyzing hepatic transcriptional profiles. Twenty-four half-sib Holstein heifers were fed four F:C diets (20:80, 40:60, 60:40, and 80:20 on a dry matter basis), with similar intake levels of metabolizable energy (ME) and crude protein. Liver biopsy samples were obtained and RNA sequencing was conducted to identify the hepatic transcriptomic changes. Moreover, the ruminal fermentation profiles, growth characteristics, and levels of metabolites in the liver and plasma of the heifers were monitored.
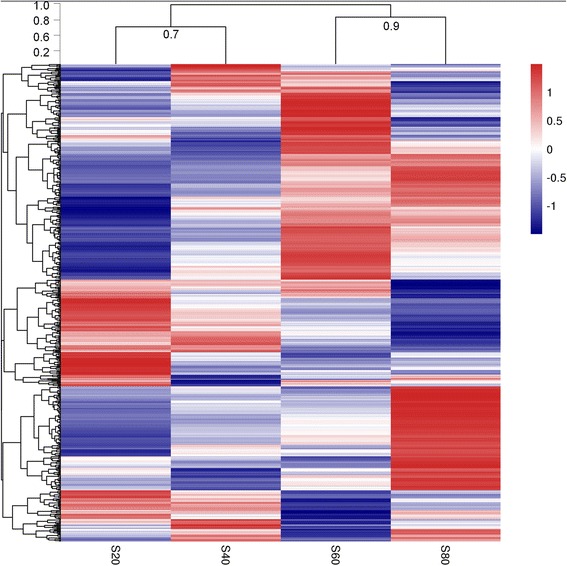
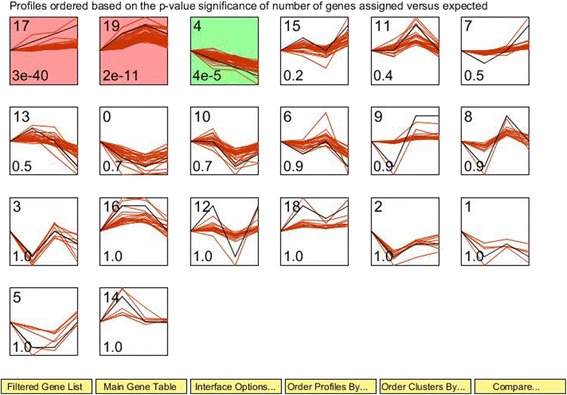
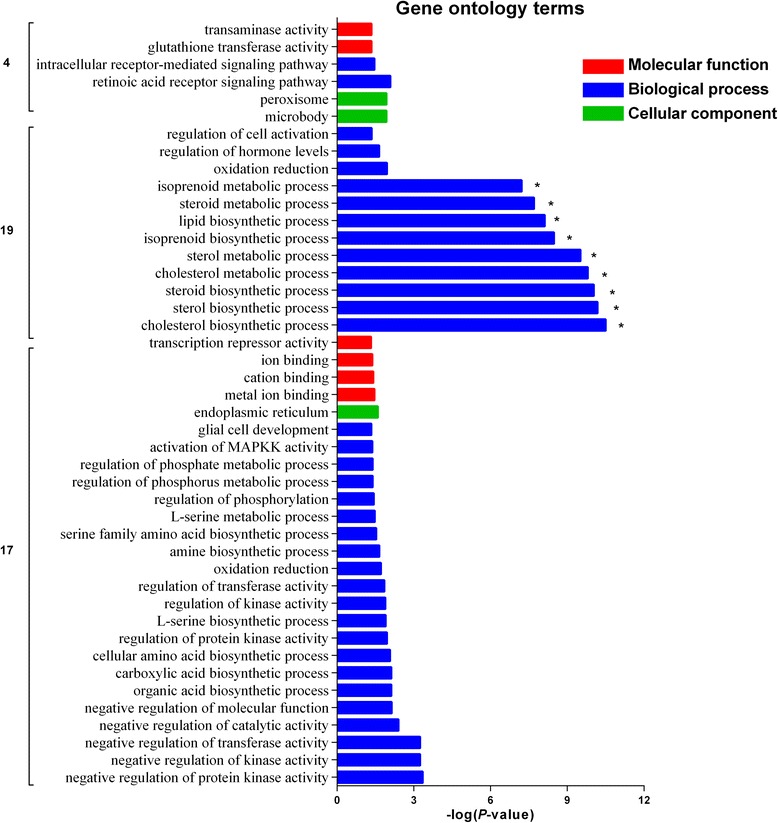
Results: The proportion of acetate showed a linear increase (P < 0.01) with increasing dietary forage levels, whereas the proportion of propionate showed a linear decline (P ≤ 0.01). Lower levels of average daily gain and feed efficiency (P < 0.01) were observed in heifers fed high levels of forage, with a significant linear response. Using the Short Time-series Expression Miner software package, the expression trends of significant differentially expressed genes (DEGs) were generally divided into 20 clusters, according to their dynamic expression patterns. Functional classification analysis showed that lipid metabolism (particularly cholesterol and steroid metabolism which were in line with the cholesterol content in the liver and plasma) was significantly increased with increasing dietary forage levels and slightly reduced by the 80% forage diet. Nine DEGs were enriched in the related pathways, namely HMGCS1, HMGCR, MSMO1, MVK, MVD, IDI1, FDPS, LSS, and DHCR7.
Conclusions: The ruminal fermentation and feed efficiency results suggest that different mechanisms of energy utilization might occur in heifers fed different F:C diets with similar levels of ME intake. Increased cholesterol synthesis from acetate might be responsible for the reduced efficiency of energy utilization in heifers fed high-forage diets.
Keywords: Energy utilization; Forage level; Heifer; Lipid metabolism; Liver; RNA-Seq.
Conflict of interest statement
Ethics approval and consent to participate
Animal care for the experiment complied with the Regulations for the Administration of Affairs Concerning Experimental Animals, National Committee of Science and Technology of China (14 November 1988) and Instructive Notions with Respect to Caring for Experimental Animals, Ministry of Science and Technology of China (13 September 2006). Animal procedures were approved by the Ethical Committee of the College of Animal Science and Technology of China Agricultural University.
Consent for publication
Not applicable.
Competing interests
The authors declare that they have no competing interests.
Publisher’s Note
Springer Nature remains neutral with regard to jurisdictional claims in published maps and institutional affiliations.
Figures


Similar articles
-
Effects of limit-feeding diets with different forage-to-concentrate ratios on nutrient intake, rumination, ruminal fermentation, digestibility, blood parameters and growth in Holstein heifers.Anim Sci J. 2018 Mar;89(3):527-536. doi: 10.1111/asj.12959. Epub 2017 Dec 12. Anim Sci J. 2018. PMID: 29231275
-
Effects of dietary energy levels on rumen bacterial community composition in Holstein heifers under the same forage to concentrate ratio condition.BMC Microbiol. 2018 Jul 11;18(1):69. doi: 10.1186/s12866-018-1213-9. BMC Microbiol. 2018. PMID: 29996759 Free PMC article.
-
Feeding different dietary protein to energy ratios to Holstein heifers: effects on growth performance, blood metabolites and rumen fermentation parameters.J Anim Physiol Anim Nutr (Berl). 2017 Feb;101(1):30-37. doi: 10.1111/jpn.12493. Epub 2016 Mar 4. J Anim Physiol Anim Nutr (Berl). 2017. PMID: 26941038 Clinical Trial.
-
Opportunities to enhance performance and efficiency through nutrient synchrony in forage-fed ruminants.J Anim Sci. 2008 Apr;86(14 Suppl):E306-17. doi: 10.2527/jas.2007-0463. Epub 2007 Oct 16. J Anim Sci. 2008. PMID: 17940154 Review.
-
The use of transcriptomics to unveil the role of nutrients in Mammalian liver.ISRN Nutr. 2013 Aug 28;2013:403792. doi: 10.5402/2013/403792. eCollection 2013. ISRN Nutr. 2013. PMID: 24967258 Free PMC article. Review.
Cited by
-
Transcriptomic analyses suggest a dominant role of insulin in the coordinated control of energy metabolism and ureagenesis in goat liver.BMC Genomics. 2019 Nov 14;20(1):854. doi: 10.1186/s12864-019-6233-9. BMC Genomics. 2019. PMID: 31726987 Free PMC article.
-
Effects of a High-Concentrate Diet on the Blood Parameters and Liver Transcriptome of Goats.Animals (Basel). 2023 May 6;13(9):1559. doi: 10.3390/ani13091559. Animals (Basel). 2023. PMID: 37174596 Free PMC article.
-
Diet Composition Affects Liver and Mammary Tissue Transcriptome in Primiparous Holstein Dairy Cows.Animals (Basel). 2020 Jul 14;10(7):1191. doi: 10.3390/ani10071191. Animals (Basel). 2020. PMID: 32674414 Free PMC article.
-
Genome-Wide Association Study for Milk Protein Composition Traits in a Chinese Holstein Population Using a Single-Step Approach.Front Genet. 2019 Feb 19;10:72. doi: 10.3389/fgene.2019.00072. eCollection 2019. Front Genet. 2019. PMID: 30838020 Free PMC article.
-
Unveiling the Genetic Landscape of Feed Efficiency in Holstein Dairy Cows: Insights into Heritability, Genetic Markers, and Pathways via Meta-Analysis.J Anim Sci. 2024 Jan 3;102:skae040. doi: 10.1093/jas/skae040. J Anim Sci. 2024. PMID: 38354297 Free PMC article.
References
-
- Wang YJ, Wood KM, Martin L, Holligan S, Kelly N, McBride BW, Fan MZ, Swanson KC. Effect of dietary corn silage inclusion on visceral organ mass, cellularity, and the protein expression of ATP synthase, Na+/K+-ATPase, proliferating cell nuclear antigen and ubiquitin in feedlot steers. Can J Anim Sci. 2009;89(4):503–512. doi: 10.4141/CJAS09022. - DOI
Publication types
MeSH terms
Grants and funding
LinkOut - more resources
Full Text Sources
Other Literature Sources
Miscellaneous
