

High resolution age-structured mapping of childhood vaccination coverage in low and middle income countries
- PMID: 29454519
- PMCID: PMC6344781
- DOI: 10.1016/j.vaccine.2018.02.020
High resolution age-structured mapping of childhood vaccination coverage in low and middle income countries
Abstract
Background: The expansion of childhood vaccination programs in low and middle income countries has been a substantial public health success story. Indicators of the performance of intervention programmes such as coverage levels and numbers covered are typically measured through national statistics or at the scale of large regions due to survey design, administrative convenience or operational limitations. These mask heterogeneities and 'coldspots' of low coverage that may allow diseases to persist, even if overall coverage is high. Hence, to decrease inequities and accelerate progress towards disease elimination goals, fine-scale variation in coverage should be better characterized.
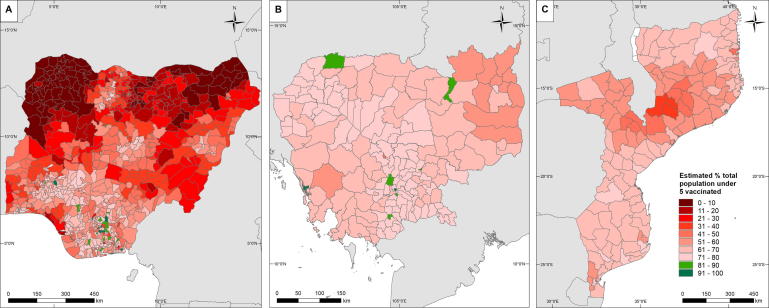
Methods: Using measles as an example, cluster-level Demographic and Health Surveys (DHS) data were used to map vaccination coverage at 1 km spatial resolution in Cambodia, Mozambique and Nigeria for varying age-group categories of children under five years, using Bayesian geostatistical techniques built on a suite of publicly available geospatial covariates and implemented via Markov Chain Monte Carlo (MCMC) methods.
Results: Measles vaccination coverage was found to be strongly predicted by just 4-5 covariates in geostatistical models, with remoteness consistently selected as a key variable. The output 1 × 1 km maps revealed significant heterogeneities within the three countries that were not captured using province-level summaries. Integration with population data showed that at the time of the surveys, few districts attained the 80% coverage, that is one component of the WHO Global Vaccine Action Plan 2020 targets.
Conclusion: The elimination of vaccine-preventable diseases requires a strong evidence base to guide strategies and inform efficient use of limited resources. The approaches outlined here provide a route to moving beyond large area summaries of vaccination coverage that mask epidemiologically-important heterogeneities to detailed maps that capture subnational vulnerabilities. The output datasets are built on open data and methods, and in flexible format that can be aggregated to more operationally-relevant administrative unit levels.
Keywords: Bayesian geostatistics; Coverage heterogeneities; Demographic and Health Surveys; Measles vaccine.
Copyright © 2018 The Author(s). Published by Elsevier Ltd.. All rights reserved.
Figures


References
-
- WHO. Global Vaccine Action Plan 2011-2020; 2013: Available from: <http://www.who.int/immunization/global_vaccine_action_plan/en/> [accessed on 20 June 2017].
-
- Pan American Health Organization. Measles elimination: Field guide (2nd Edition). Scientific and Technical Publication No. 605. Washington, DC; 2005.
-
- WHO. Measles vaccines: WHO position paper. Weekly Epidemiol Rec 2009;84(35):349–60. - PubMed
Publication types
MeSH terms
Substances
Grants and funding
LinkOut - more resources
Full Text Sources
Other Literature Sources
Medical
