. 2018 May;188(5):1246-1262.
doi: 10.1016/j.ajpath.2018.01.008. Epub 2018 Feb 16.

Strain-Dependent Variation in Acute Ischemic Muscle Injury

Affiliations

Strain-Dependent Variation in Acute Ischemic Muscle Injury

Cameron A Schmidt et al. Am J Pathol. 2018 May.

Abstract

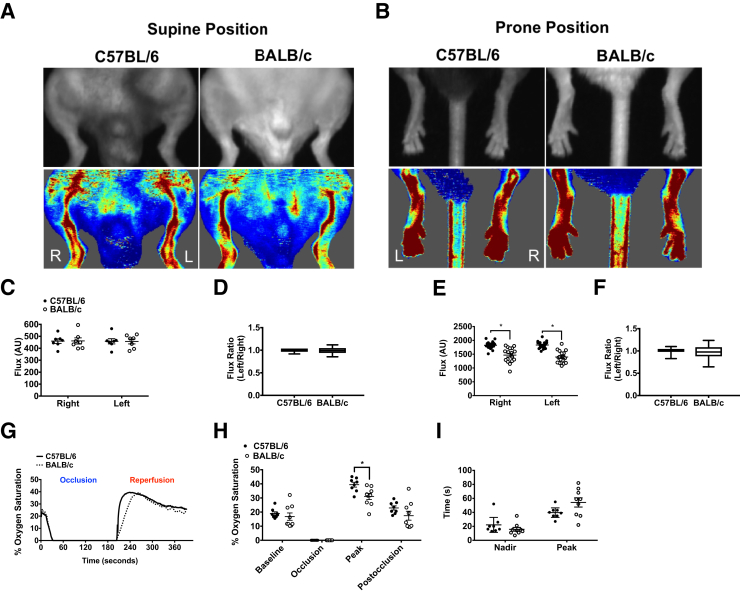
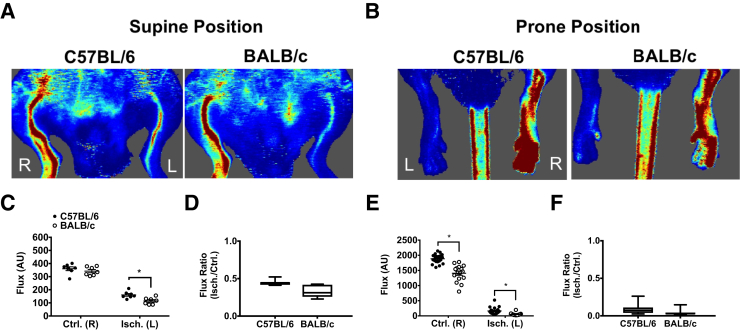
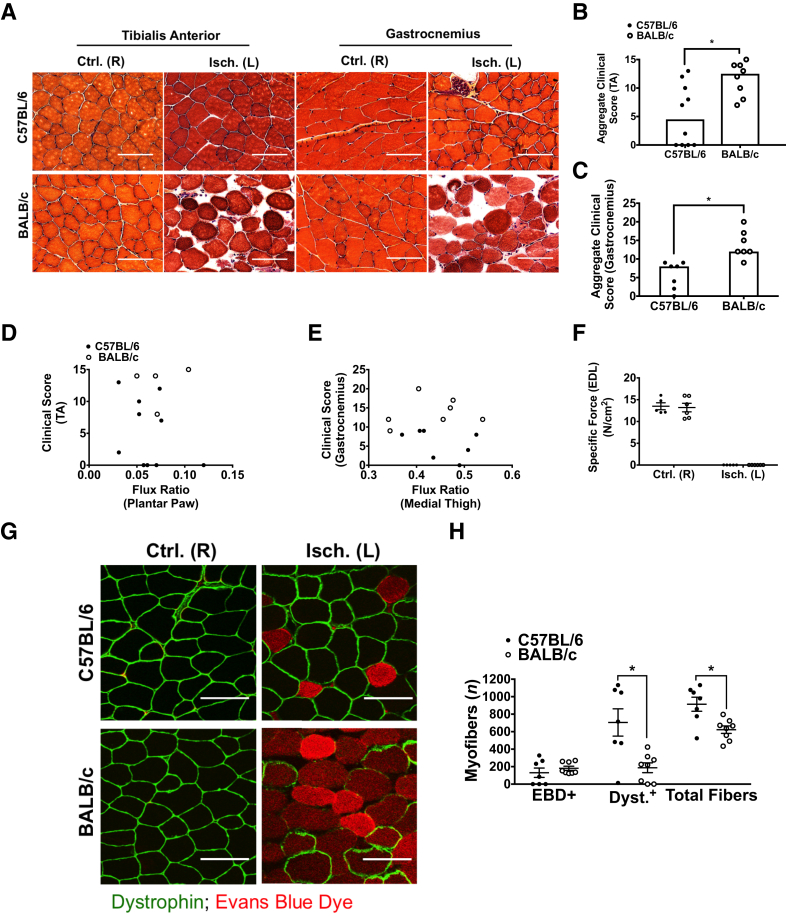
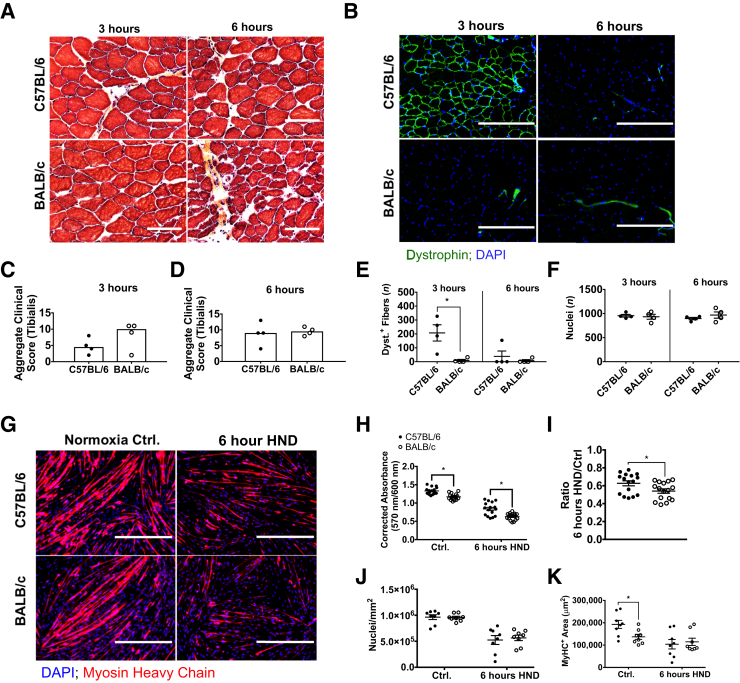
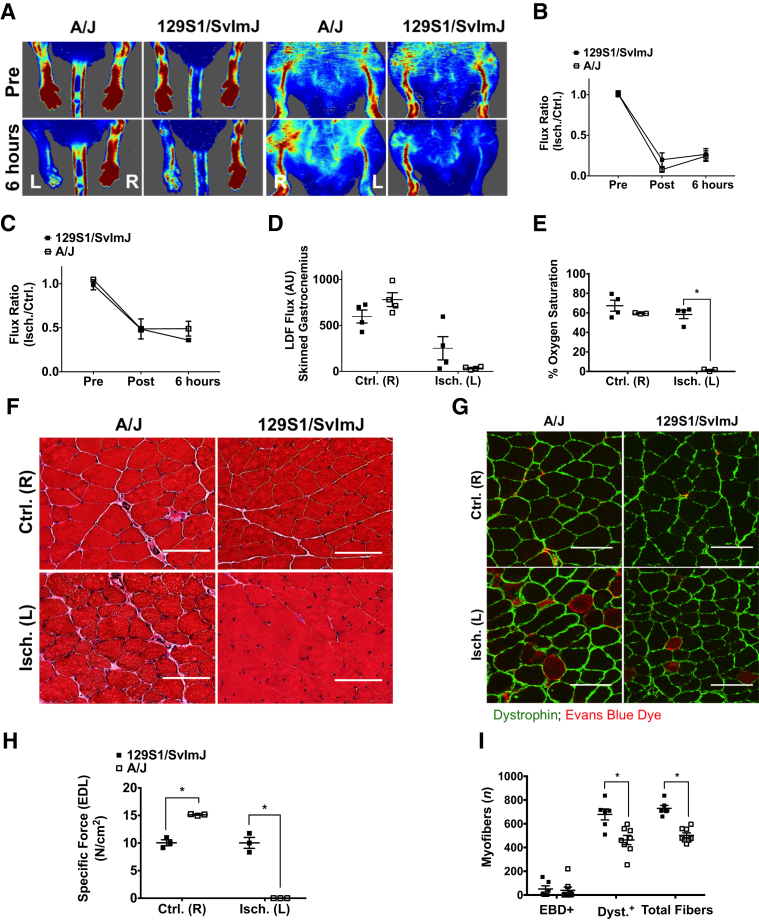
Limited efficacy of clinical interventions for peripheral arterial disease necessitates a better understanding of the environmental and genetic determinants of tissue pathology. Existing research has largely ignored the early skeletal muscle injury response during hind limb ischemia (HLI). We compared the hind limb muscle response, after 6 hours of ischemia, in two mouse strains that differ dramatically in their postischemic extended recovery: C57BL/6J and BALB/cJ. Perfusion, measured by laser Doppler and normalized to the control limb, differed only slightly between strains after HLI (<12% across all measures). Similar (<10%) effect sizes in lectin-perfused vessel area and no differences in tissue oxygen saturation measured by reflectance spectroscopy were also found. Muscles from both strains were functionally impaired after HLI, but greater muscle necrosis and loss of dystrophin-positive immunostaining were observed in BALB/cJ muscle compared with C57BL/6J. Muscle cell-specific dystrophin loss and reduced viability were also detected in additional models of ischemia that were independent of residual perfusion differences. Our results indicate that factors other than the completeness of ischemia alone (ie, background genetics) influence the magnitude of acute ischemic muscle injury. These findings may have implications for future development of therapeutic interventions for limb ischemia and for understanding the phasic etiology of chronic and acute ischemic muscle pathophysiology.


Figures

Figure 1
Figure 1
Perfusion status and hemodynamics are similar at baseline in C57 and B/c parental strains of mice. A: Representative camera and laser Doppler perfusion images (LDPIs) of the left (L) and right (R) limbs in the supine position at baseline. B: Representative LDPIs of the L and R plantar paws in the prone position at baseline. C and D: Quantification of flux measurements in the supine position represented as arbitrary perfusion units (AUs) and as a ratio of the left over the right limbs. E and F: Quantification of flux measurements in the prone position. G: Representative traces showing postocclusive reactive hyperoxia (PORH), measured by white light reflectance spectroscopy, in the left vastus medialis muscle after 3-minute occlusion and 3-minute reperfusion of the femoral artery. H: Percentage oxygen saturation values measured during PORH protocol. I: Time to nadir/peak after occlusion and reperfusion. Bars in box-and-whisker plots indicate median, interquartile range, and maximum/minimum values (D and F). Data are expressed as means ± SEM (C, E, H, and I). n = 7 BALB/c (C and D); n = 8 C57BL/6 (C and D); n = 20 per group (E and F); n = 1 per group (G); n = 8 per group (H and I). P < 0.05.
Figure 2
Figure 2
Perfusion status is similar in C57 and B/c mice immediately after femoral artery ligation. A: Representative laser Doppler perfusion images (LDPIs) of the ischemic left [Isch. (L)] and control right [Ctrl. (R)] limbs in the supine position immediately after hind limb ischemia surgery. B: Representative LDPIs of the Isch. (L) and Ctrl. (R) plantar paws in the prone position. C and D: Quantification of flux measurements in the supine position represented as arbitrary perfusion units (AUs) and as a ratio of the left over the right limbs. E and F: Quantification of flux measurements in the prone position represented as AUs and as a ratio of the left over the right limbs. Bars indicate median, interquartile range, and maximum/minimum values (D and F). Data are expressed as means ± SEM (C and E). n = 7 BALB/c (C and D); n = 8 C57BL/6 (C and D); n = 20 per group (E and F). P < 0.05.
Figure 3
Figure 3
Residual blood perfusion and tissue oxygenation are similar in the ischemic limbs of C57 and B/c mice after 6 hours of acute hind limb ischemia. A: Representative laser Doppler perfusion images (LDPIs) of the ischemic left [Isch. (L)] and control right [Ctrl. (R)] limbs in the supine position after 6 hours of acute hind limb ischemia. B: Representative LDPIs of the Isch. (L) and Ctrl. (R) limbs in the prone position after 6 hours of acute hind limb ischemia. C and D: Quantification of flux measurements in the supine position represented as arbitrary perfusion units (AU) and as ratio of the Isch. (L)/Ctrl. (R) limbs. E and F: Quantification of flux measurements in the prone position represented as AUs and as a ratio of the Isch. (L)/Ctrl. (R) limbs. G and H: Laser Doppler flowmetry (LDF) measurements made directly over the lateral head of the gastrocnemius muscles in the absence of interference from skin pigmentation. I: Percentage oxygen saturation values measured directly over the vastus lateralis, lateral head of the gastrocnemius, tibialis anterior, and plantar paw in the Ctrl. (R) and Isch. (L) limbs of both strains. Bars indicate median, interquartile range, and maximum/minimum values (D, F, and H). Data are expressed as means ± SEM (CE, G, and I). n = 7 BALB/c (C and D); n = 8 C57BL/6 (C and D); n = 14 per group (E and F); n = 18 per group (G and H); n = 14 per group (I). P < 0.05.
Figure 4
Figure 4
Total and perfused vessels are similar in the ischemic muscle of C57 and B/c mice after 6 hours of acute hind limb ischemia. A: Representative immunofluorescence images of CD31+ (platelet endothelial cell adhesion molecule 1), indicating total vessels; and systemically injected Dylight594–conjugated Griffonia simplicolia isolectin-B4 (GS-IB4) lectin, indicating perfused vessels in transverse sections of gastrocnemius muscle from both strains after 6 hours of acute hind limb ischemia. Representative images are 2× digital zoom from images. B and C: Mean total vessel CD31+ area per image in the control right [Ctrl. (R)] and ischemic left [Isch. (L)] limbs represented by absolute values and the ratio of the Isch./Ctrl. limbs. D and E: Mean total vessel (lectin-Dylight594+) area per image in the control right and ischemic left limbs represented by absolute values and the ratio of the Isch./Ctrl. limbs. Bars indicate median, interquartile range, and maximum/minimum values (C and E). Data are expressed as means ± SEM (B and D). n = 7 animals per group. P < 0.05. Scale bars = 50 μm (B and D). Original magnification: ×20 (AE).
Figure 5
Figure 5
Skeletal muscle histomorphology, myofiber permeability, and dystrophin immunostaining differ significantly in C57 and B/c mice after 6 hours of acute hind limb ischemia, despite muscle functional impairment in both strains. A: Representative images of hematoxylin and eosin–stained sections from the control right [Ctrl. (R)] and ischemic left [Isch. (L)] tibialis anterior (TA) and gastrocnemius muscles. B: Aggregate clinical scores from three images for each animal assessed in the tibialis anterior muscles; maximal score of 15 indicates most severe ischemic damage. C: Aggregate clinical scores from five images for each animal assessed in the gastrocnemius muscles; maximal score of 25 indicates most severe ischemic damage. D: Scatter plot of clinical score in the TA versus laser Doppler perfusion images (LDPI) flux ratio in the plantar paw. E: Scatter plot of clinical score in the gastrocnemius versus LDPI flux ratio in the medial thigh. F: Peak specific force production after maximal stimulation (120 Hz) in isolated extensor digitorum longus (EDL) muscles represented in N/cm2. G: Representative images of Evans Blue Dye (EBD)–positive myofibers and dystrophin immunostaining in transverse sections of Isch. (L) and Ctrl. (R) TA muscles from both strains after 6 hours of hind limb ischemia. H: Mean number of EBD+, dystrophin-positive (Dyst.+), or total fibers from three images for each animal assessed in the Isch. (L) TA muscles of both strains. Representative images are 2× digital zoom from images. Bars indicate the median (B and C). Data are expressed as means ± SEM (F and H). n = 8 BALB/c (B); n = 10 C57BL/6 (B); n = 7 per group (C); n = 4 BALB/c (D); n = 10 C57BL/6 (D); n = 7 per group (E); n = 6 per group (F); n = 8 BALB/c (H), n = 7 C57BL/6 (H). P < 0.05. Scale bars = 50 μm (A and G). Original magnification: ×20 (A and G).
Figure 6
Figure 6
Skeletal muscle response to ischemia differs between C57 and B/c mice in the complete absence of residual flow. A: Representative images (2× digital zoom) of hematoxylin and eosin–stained sections of tibialis anterior muscle from C57 and B/c mice at 3 and 6 hours after euthanasia by cervical dislocation (postmortem). B: Representative images (2× digital zoom) of dystrophin immunostaining in transverse sections of tibialis anterior muscles 3 and 6 hours postmortem. C and D: Aggregate clinical scores from three images for each animal assessed in the tibialis anterior muscles; maximal score of 15 indicates most severe ischemic damage. Bars in dot plots indicate the median. E and F: Mean number of dystrophin positive (Dyst.+) fibers and DAPI-stained nuclei 3 and 6 hours postmortem from two images for each animal assessed in the tibialis anterior of both strains. G: Representative images of myosin heavy chain (MyHC)–immunostained primary myotubes after exposure to 6 hours of hypoxia and nutrient deprivation (HND) or normoxia without nutrient deprivation. H and I: Cell viability indicated by corrected resorufin dye absorbance at 570 nm in primary myotubes represented as mean corrected absorbance and as a ratio of HND/normoxia controls (Ctrl). J and K: Number of DAPI-stained nuclei and MyHC immunostain-positive area were measured to indicate the relative amount of cells present after each treatment. Bars indicate means (C and D). Data are expressed as means ± SEM (E, F, and H–K). n = 4 animals per group (AF); n = 16 per group (H and I); n = 8 per group (J and K). P < 0.05. Scale bars: 50 μm (A); 200 μm (B); 400 μm (G). Original magnification: ×10 (B, E, F–K); ×20 (A, C, D).
Figure 7
Figure 7
Dramatic ischemic muscle injury is not observed in additional inbred mouse strains tested. A: Representative laser Doppler perfusion images (LDPIs) of the ischemic left [Isch. (L)] and control right [Ctrl. (R)] limbs in the prone and supine positions at baseline and after 6 hours of hind limb ischemia (HLI). B: LDPI flux ratio before HLI (Pre), immediately after HLI (Post), and after 6 hours of HLI measured in the plantar paw. C: LDPI flux ratio Pre, Post, and after 6 hours of HLI measured in the medial thigh. D: Laser Doppler flowmetry (LDF) measurements made directly over the lateral head of the gastrocnemius muscles in the absence of interference from skin pigmentation after 6 hours of HLI in the Ctrl. (R) and Isch. (L) limbs. E: Percentage oxygen saturation values measured directly over the lateral head of the gastrocnemius in the Ctrl. (R) and Isch. (L) limbs. F: Representative images of hematoxylin and eosin–stained sections from the Ctrl. (R) and Isch. (L) gastrocnemius muscles. G: Representative images of Evans Blue Dye (EBD)–positive myofibers and dystrophin immunostaining in transverse sections of Isch. (L) and Ctrl. (R) gastrocnemius muscles from both strains after 6 hours of HLI. H: Peak specific force production after maximal stimulation (120 Hz) in isolated extensor digitorum longus (EDL) muscles represented in units of N/cm2. I: Mean number of EBD+, dystrophin-positive (Dyst.+), or total fibers from two images for each animal assessed in the Isch. (L) gastrocnemius muscles of both strains. Data are expressed as means ± SEM (B-E, H, and I). Representative images are 2× digital zoom from images collected at ×20 (F and G). n = 4 per group (BE); n = 3 per group (H); n = 8 BALB/c (I); n = 6 C57BL/6 (I). P < 0.05. Scale bars = 50 μm (F and G). Original magnification: ×20 (F and G); ×10 (I). AU, arbitrary unit.

Similar articles

Cited by

References

    1. Hiatt W.R., Armstrong E.J., Larson C.J., Brass E.P. Pathogenesis of the limb manifestations and exercise limitations in peripheral artery disease. Circ Res. 2015;116:1527–1539. - PubMed
    1. Brass E.P., Hiatt W.R. Acquired skeletal muscle metabolic myopathy in atherosclerotic peripheral arterial disease. Vasc Med. 2000;5:55–59. - PubMed
    1. Callum K., Bradbury A. ABC of arterial and venous disease: acute limb ischaemia. BMJ. 2000;320:764–767. - PMC - PubMed
    1. Couffinhal T., Silver M., Zheng L.P., Kearney M., Witzenbichler B., Isner J.M. Mouse model of angiogenesis. Am J Pathol. 1998;152:1667–1679. - PMC - PubMed
    1. Scholz D., Ziegelhoeffer T., Helisch A., Wagner S., Friedrich C., Podzuweit T., Schaper W. Contribution of arteriogenesis and angiogenesis to postocclusive hindlimb perfusion in mice. J Mol Cell Cardiol. 2002;34:775–787. - PubMed

Publication types

LinkOut - more resources