Effects of resting state condition on reliability, trait specificity, and network connectivity of brain function measured with arterial spin labeled perfusion MRI
- PMID: 29454933
- PMCID: PMC5957091
- DOI: 10.1016/j.neuroimage.2018.02.028
Effects of resting state condition on reliability, trait specificity, and network connectivity of brain function measured with arterial spin labeled perfusion MRI
Abstract
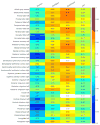
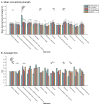
Resting state fMRI (rs-fMRI) provides imaging biomarkers of task-independent brain function that can be associated with clinical variables or modulated by interventions such as behavioral training or pharmacological manipulations. These biomarkers include time-averaged regional brain function as manifested by regional cerebral blood flow (CBF) measured using arterial spin labeled (ASL) perfusion MRI and correlated temporal fluctuations of function across brain networks with either ASL or blood oxygenation level dependent (BOLD) fMRI. Resting-state studies are typically carried out using just one of several prescribed state conditions such as eyes closed (EC), eyes open (EO), or visual fixation on a cross-hair (FIX), which may affect the reliability and specificity of rs-fMRI. In this study, we collected test-retest ASL MRI data during 4 resting-state task conditions: EC, EO, FIX and PVT (low-frequency psychomotor vigilance task), and examined the effects of these task conditions on reliability and reproducibility as well as trait specificity of regional brain function. We also acquired resting-state BOLD fMRI under FIX and compared the network connectivity reliabilities between the four ASL conditions and the BOLD FIX condition. For resting-state ASL data, EC provided the highest CBF reliability, reproducibility, trait specificity, and network connectivity reliability, followed by EO, while FIX was lowest on all of these measures. PVT demonstrated lower CBF reliability, reproducibility and trait specificity than EO and EC. Overall network connectivity reliability was comparable between ASL and BOLD. Our findings confirm ASL CBF as a reliable, stable, and consistent measure of resting-state regional brain function and support the use of EC or EO over FIX and PVT as the resting-state condition.
Keywords: Arterial spin labeled (ASL) perfusion MRI; Network connectivity; Reliability; Resting state conditions; Trait specificity.
Copyright © 2018 The Authors. Published by Elsevier Inc. All rights reserved.
Figures


Similar articles
-
Test-retest reliability of cerebral blood flow for assessing brain function at rest and during a vigilance task.Neuroimage. 2019 Jun;193:157-166. doi: 10.1016/j.neuroimage.2019.03.016. Epub 2019 Mar 17. Neuroimage. 2019. PMID: 30894335
-
Reliability comparison of spontaneous brain activities between BOLD and CBF contrasts in eyes-open and eyes-closed resting states.Neuroimage. 2015 Nov 1;121:91-105. doi: 10.1016/j.neuroimage.2015.07.044. Epub 2015 Jul 27. Neuroimage. 2015. PMID: 26226087
-
Functional connectivity in BOLD and CBF data: similarity and reliability of resting brain networks.Neuroimage. 2015 Feb 1;106:111-22. doi: 10.1016/j.neuroimage.2014.11.028. Epub 2014 Nov 21. Neuroimage. 2015. PMID: 25463468 Free PMC article.
-
Characterizing Resting-State Brain Function Using Arterial Spin Labeling.Brain Connect. 2015 Nov;5(9):527-42. doi: 10.1089/brain.2015.0344. Epub 2015 Oct 6. Brain Connect. 2015. PMID: 26106930 Free PMC article. Review.
-
Arterial spin-labeled perfusion MRI in basic and clinical neuroscience.Curr Opin Neurol. 2009 Aug;22(4):348-55. doi: 10.1097/WCO.0b013e32832d9505. Curr Opin Neurol. 2009. PMID: 19491678 Review.
Cited by
-
Comparison of Cerebral Blood Flow in Regions Relevant to Cognition After Enzalutamide, Darolutamide, and Placebo in Healthy Volunteers: A Randomized Crossover Trial.Target Oncol. 2023 May;18(3):403-413. doi: 10.1007/s11523-023-00959-5. Epub 2023 Apr 27. Target Oncol. 2023. PMID: 37103658 Free PMC article. Clinical Trial.
-
Mapping the orbitofrontal cortex using temporal fluctuations in cerebral blood flow.Brain Behav. 2021 Mar;11(3):e02034. doi: 10.1002/brb3.2034. Epub 2021 Jan 13. Brain Behav. 2021. PMID: 33438840 Free PMC article.
-
The effect of acquisition duration on cerebral blood flow-based resting-state functional connectivity.Hum Brain Mapp. 2022 Jul;43(10):3184-3194. doi: 10.1002/hbm.25843. Epub 2022 Mar 26. Hum Brain Mapp. 2022. PMID: 35338768 Free PMC article.
-
Arterial Spin Labeling Perfusion in Pediatric Brain Tumors: A Review of Techniques, Quality Control, and Quantification.Cancers (Basel). 2022 Sep 28;14(19):4734. doi: 10.3390/cancers14194734. Cancers (Basel). 2022. PMID: 36230655 Free PMC article. Review.
-
Opening or closing eyes at rest modulates the functional connectivity of V1 with default and salience networks.Sci Rep. 2020 Jun 4;10(1):9137. doi: 10.1038/s41598-020-66100-y. Sci Rep. 2020. PMID: 32499585 Free PMC article.
References
-
- Aguirre G, Detre J, Zarahn E, Alsop D. Experimental design and the relative sensitivity of BOLD and perfusion fMRI. Neuroimage. 2002;15:488–500. - PubMed
-
- Almeida JRC, Greenberg T, Lu H, Chase HW, Fournier J, Cooper CM, Deckersbach T, Adams P, Carmody T, Fava M, Kurian B, McGrath PJ, McInnis M, Oquendo MA, Parsey R, Weissman M, Trivedi M, Phillips ML. Test-retest reliability of cerebral blood flow in healthy individuals using arterial spin labeling: findings from the EMBARC study. Magn Reson Imaging. 2018;45:26–33. - PMC - PubMed
-
- Alsop DC, Detre JA. Reduced transit-time sensitivity in noninvasive magnetic resonance imaging of human cerebral blood flow. J Cerebr Blood Flow Metabol : Offic J Int Soc Cerebr Blood Flow Metabol. 1996;16:1236–1249. - PubMed
-
- Alsop DC, Detre JA, Golay X, Gunther M, Hendrikse J, Hernandez-Garcia L, Lu H, MacIntosh BJ, Parkes LM, Smits M, van Osch MJ, Wang DJ, Wong EC, Zaharchuk G. Recommended implementation of arterial spin-labeled perfusion MRI for clinical applications: a consensus of the ISMRM perfusion study group and the European consortium for ASL in dementia. Magn Reson Med. 2015;73:102–116. - PMC - PubMed
Publication types
MeSH terms
Substances
Grants and funding
LinkOut - more resources
Full Text Sources
Other Literature Sources
Medical

