

Time scale properties of task and resting-state functional connectivity: Detrended partial cross-correlation analysis
- PMID: 29454934
- PMCID: PMC5911227
- DOI: 10.1016/j.neuroimage.2018.02.029
Time scale properties of task and resting-state functional connectivity: Detrended partial cross-correlation analysis
Abstract
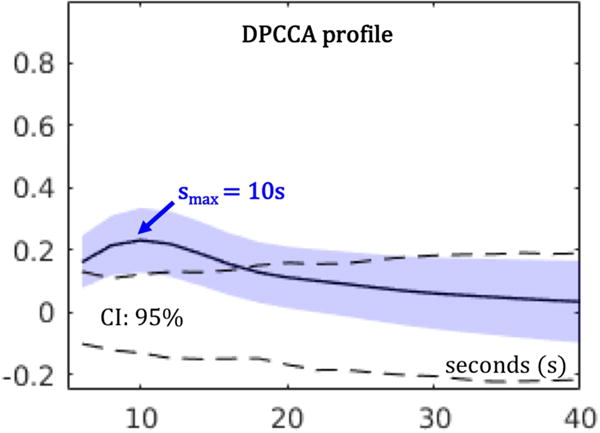
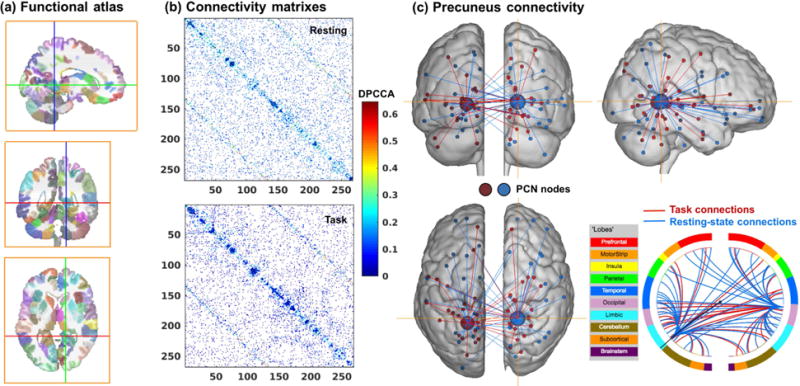
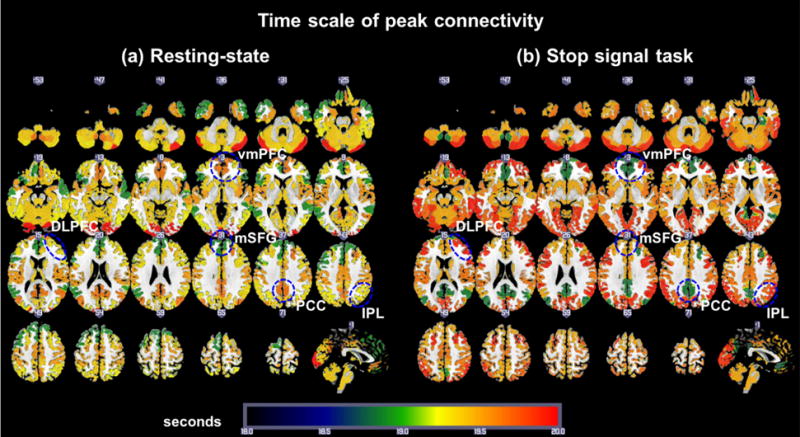
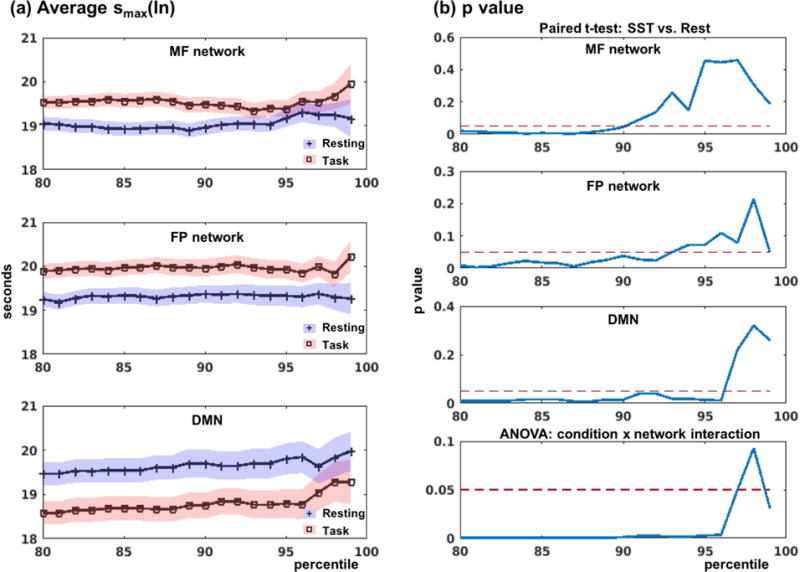
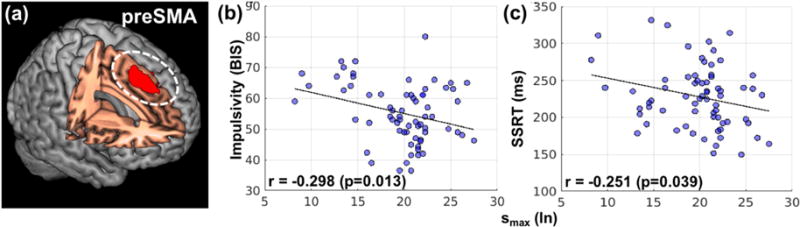
Functional connectivity analysis is an essential tool for understanding brain function. Previous studies showed that brain regions are functionally connected through low-frequency signals both within the default mode network (DMN) and task networks. However, no studies have directly compared the time scale (frequency) properties of network connectivity during task versus rest, or examined how they relate to task performance. Here, using fMRI data collected from sixty-eight subjects at rest and during a stop signal task, we addressed this issue with a novel functional connectivity measure based on detrended partial cross-correlation analysis (DPCCA). DPCCA has the advantage of quantifying correlations between two variables in different time scales while controlling for the influence of other variables. The results showed that the time scales of within-network connectivity of the DMN and task networks are modulated in opposite directions across rest and task, with the time scale increased during rest vs. task in the DMN and vice versa in task networks. In regions of interest analysis, the within-network connectivity time scale of the pre-supplementary motor area - a medial prefrontal cortical structure of the task network and critical to proactive inhibitory control - correlated inversely with Barratt impulsivity and stop signal reaction time. Together, these findings demonstrate that time scale properties of brain networks may vary across mental states and provide evidence in support of a role of low frequency fluctuations of BOLD signals in behavioral control.
Keywords: DPCCA; Functional connectivity; Multiple time scales; Resting state; Stop-signal task; preSMA.
Copyright © 2018 Elsevier Inc. All rights reserved.
Figures
References
-
- Achard S, Bassett DS, Meyer-Lindenberg A, Bullmore E. Fractal connectivity of long-memory networks. Phys Rev E Stat Nonlin Soft Matter Phys. 2008;77:036104. - PubMed
-
- Andersson JL, Hutton C, Ashburner J, Turner R, Friston K. Modeling geometric deformations in EPI time series. Neuroimage. 2001;13:903–919. - PubMed
-
- Ashburner J, Friston KJ. Unified segmentation. Neuroimage. 2005;26:839–851. - PubMed
Publication types
MeSH terms
Grants and funding
LinkOut - more resources
Full Text Sources
Other Literature Sources
