. 2018 Feb 28;6(2):171-179.e5.
doi: 10.1016/j.cels.2018.01.014. Epub 2018 Feb 14.

Rare Cell Detection by Single-Cell RNA Sequencing as Guided by Single-Molecule RNA FISH

Affiliations

Rare Cell Detection by Single-Cell RNA Sequencing as Guided by Single-Molecule RNA FISH

Eduardo Torre et al. Cell Syst. .

Abstract

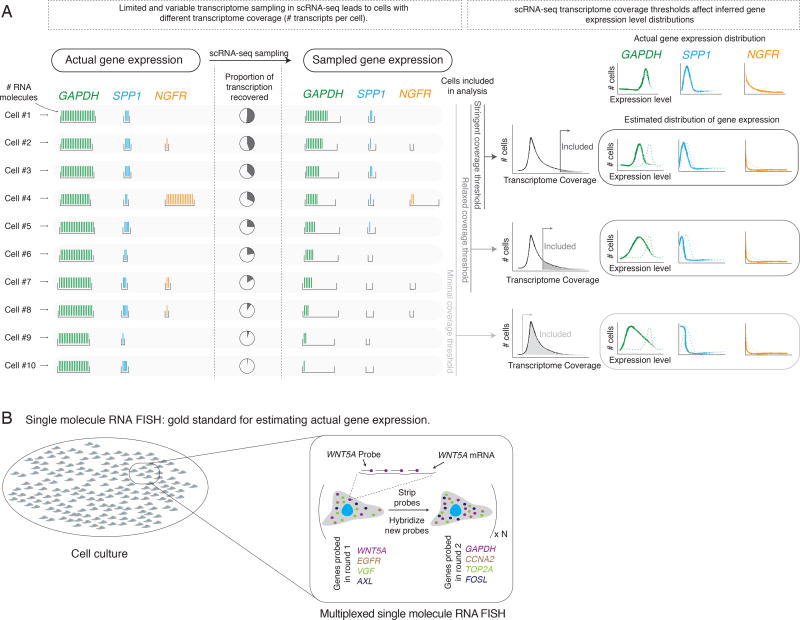
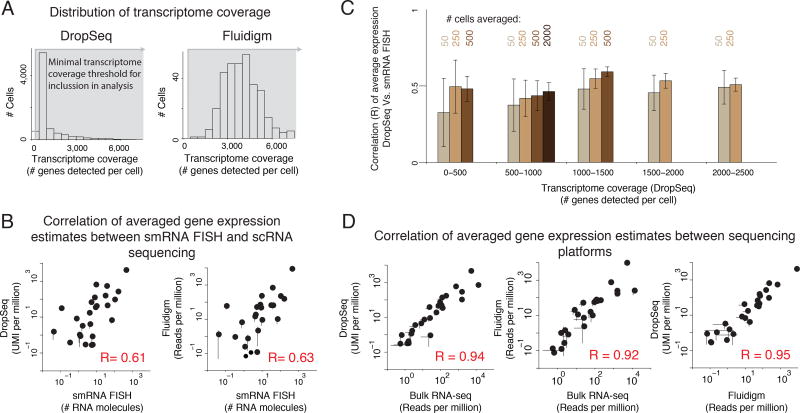
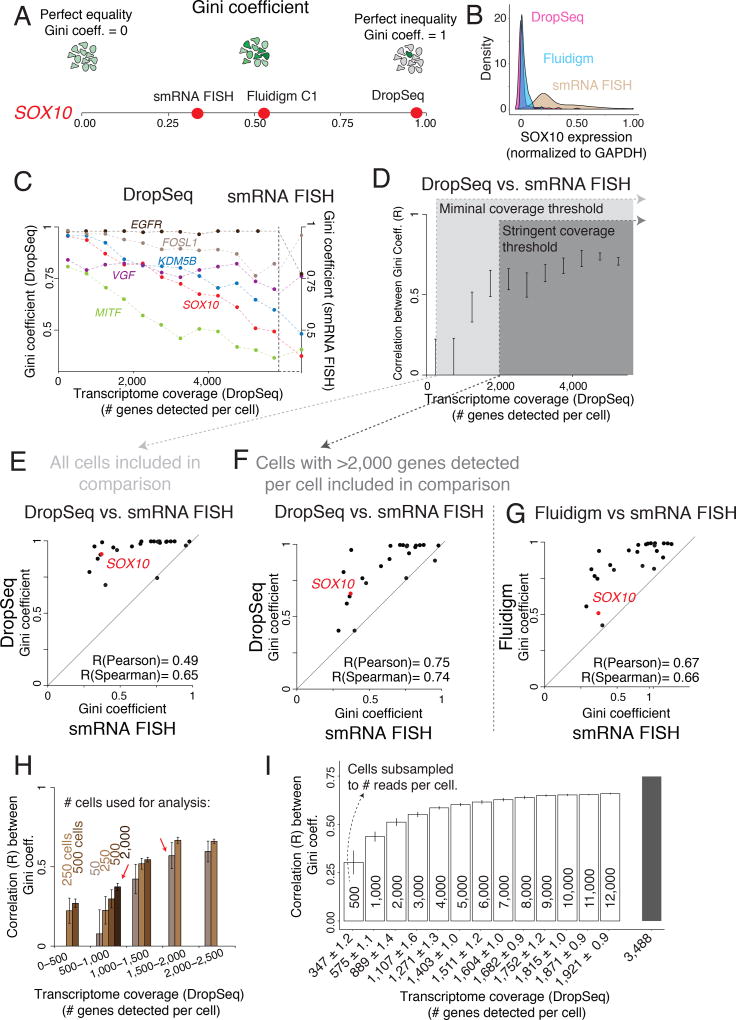
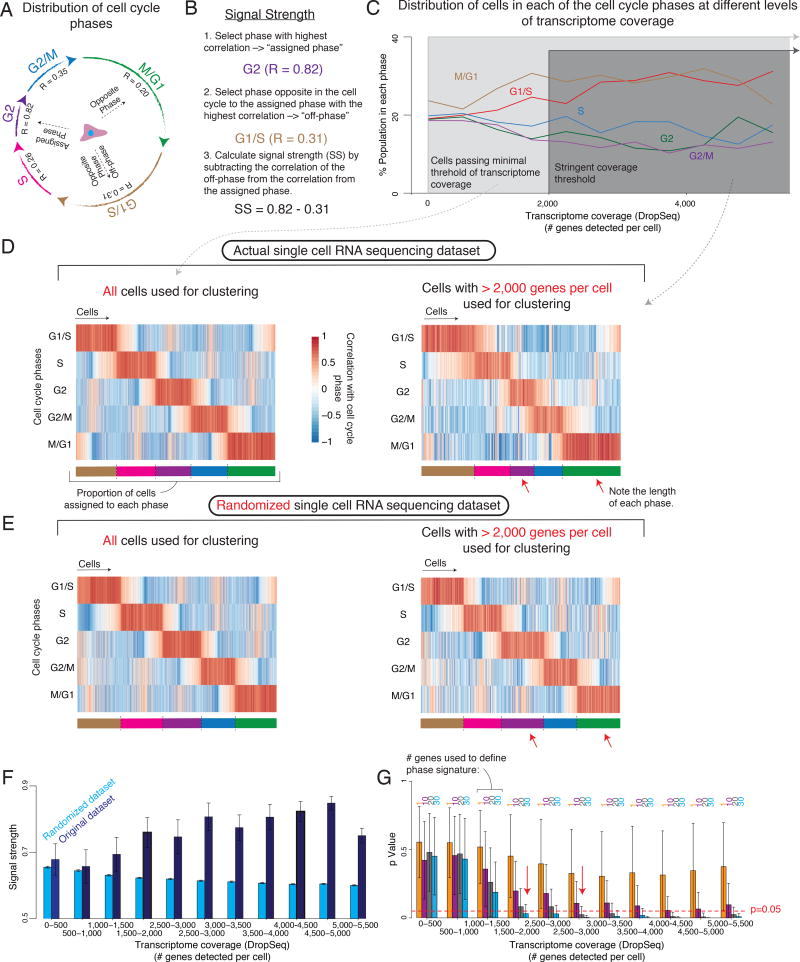
Although single-cell RNA sequencing can reliably detect large-scale transcriptional programs, it is unclear whether it accurately captures the behavior of individual genes, especially those that express only in rare cells. Here, we use single-molecule RNA fluorescence in situ hybridization as a gold standard to assess trade-offs in single-cell RNA-sequencing data for detecting rare cell expression variability. We quantified the gene expression distribution for 26 genes that range from ubiquitous to rarely expressed and found that the correspondence between estimates across platforms improved with both transcriptome coverage and increased number of cells analyzed. Further, by characterizing the trade-off between transcriptome coverage and number of cells analyzed, we show that when the number of genes required to answer a given biological question is small, then greater transcriptome coverage is more important than analyzing large numbers of cells. More generally, our report provides guidelines for selecting quality thresholds for single-cell RNA-sequencing experiments aimed at rare cell analyses.

Keywords: single molecule RNA FISH; single-cell RNA sequencing; single-cell analysis.


Conflict of interest statement

Declaration of Interests

A.R. receives consulting income, and A.R. and S.S. receive royalties related to Stellaris RNA FISH probes. All other authors declare no competing interests.

Figures

Figure 1
Figure 1. Technical sampling in single cell RNA sequencing can qualitatively change gene expression distributions
(A) Single cell RNA sequencing (scRNA-seq) subsamples the actual transcriptome (left) to an observed transcriptome (middle). Different cells (horizontal rows) can have different degrees of transcriptome coverage. Depending on the number of cells analyzed, the observed expression distribution for any particular gene may not reflect the true distribution (right). We schematically depicted three classes of genes: high, minimally variable expression (GAPDH); low, minimally variable expression (SPP1); rare cells with high expression (NGFR). (B) Multiplexed single molecule RNA FISH is the gold standard for estimating gene expression at the single cell level. In each round of hybridization, we probe four genes, each with a set of DNA probes containing a common fluorophore. After imaging the resulting RNA spots, we strip the probes, and hybridize a new set of probes.
Figure 2
Figure 2. Averaging gene expression estimates across all cells in single cell RNA sequencing shows good correspondence across platforms
(A) Distribution of transcriptome coverage (# genes detected per cell) for DropSeq (left) and Fluidigm (right). (B) Correlation of averaged gene expression estimates between single molecule RNA FISH (smRNA FISH) and single cell RNA sequencing (scRNA-seq). (C) Correlation of average gene expression estimates between DropSeq and smRNA FISH at different levels of transcriptome coverage using four different population sizes (50, 250, 500, and 2000 cells). Error bars in (C) represent ± 1 standard deviation across bootstrap replicates. (D) Correlation of averaged gene expression estimates between sequencing platforms. Error bars in (B and D) represent two times the standard error of the mean (SEM).
Figure 3
Figure 3. Estimates of gene expression heterogeneity in single cell RNA sequencing are highly dependent on transcriptome coverage
(A) The Gini coefficient measures a gene’s expression distribution and captures rare cell population heterogeneity. (B) Population structure of SOX10 mRNA levels measured by DropSeq (pink), Fluidigm (blue), and single molecule RNA FISH (smRNA FISH, brown). (C) Gini coefficient for six genes measured by DropSeq (left y-axis) binned by levels of transcriptome coverage as well as Gini coefficients measured by smRNA FISH (right y-axis). (D) Pearson correlation between Gini coefficients measured through DropSeq and smRNA FISH across different levels of transcriptome coverage (# genes detected per cell). Error bars represent ± 1 standard deviation across bootstrap replicates. (E,F) Scatter Plot of the correspondence between Gini coefficients for 26 genes measured by both DropSeq and smRNA FISH. (G) Scatter Plot of the correspondence between Gini coefficients for 26 genes measured by Fluidigm and smRNA FISH. (H) Pearson correlation between Gini coefficient estimates measured by DropSeq and smRNA FISH using different population sizes (# of cells) and levels of transcriptome coverage. Error bars represent ± 1 standard deviation across bootstrap replicates. (I) Pearson correlation between Gini coefficient estimates measured by DropSeq and smRNA FISH after subsampling cells with high transcriptome coverage to different degrees of reads depth. Numbers inside the bars represent the number of reads subsampled. The x-axis represents the average number of genes detected across all cells at a given subsample depth. Error bars represent ± 1 standard deviation across bootstrap replicates.
Figure 4
Figure 4. Correct classification of single cells into multi-genic states is dependent on transcriptome coverage
(A) Schematic depiction of the length of the cell cycle phases. (B) Calculation of a cell’s Signal Strength. (C) Percent of cells assigned to a cell cycle phase at different levels of transcriptome coverage (# genes detected per cell). (D, E) Heatmaps representing the correlation of a cell’s gene expression signature (columns) with each of the cell cycle phases (rows) for the DropSeq dataset (D) as well as for a null model (E) where the expression level of all cycling genes were randomly shuffled within each cell. We analyzed either all cells (left) or only cells with > 2,000 genes detected per cell (right). Below each heatmap is a representation of the proportion cells assigned to each phase of the cell cycle. Notice the length of each bar. (F) Signal strength across different levels of transcriptome coverage for DropSeq and a null model of randomized DropSeq data. Error bars represent ± 1 standard deviation across bootstrap replicates. (G) p-value of signal strength at different levels of transcriptome coverage using different number of genes to characterize the phase. Bar height indicates mean across bootstrap replicates. Error bars represent ± 1 standard deviation across bootstrap replicates.

Comment in

Similar articles

Cited by

References

    1. Battich Nico, Stoeger Thomas, Pelkmans Lucas. Control of Transcript Variability in Single Mammalian Cells. Cell. 2015;163(7):1596–1610. - PubMed
    1. Brennecke Philip, Anders Simon, Kim Jong Kyoung, Kołodziejczyk Aleksandra A, Zhang Xiuwei, Proserpio Valentina, Baying Bianka, et al. Accounting for Technical Noise in Single-Cell RNA-Seq Experiments. Nature Methods. 2013;10(11):1093–95. - PubMed
    1. Cabili Moran N, Dunagin Margaret C, McClanahan Patrick D, Biaesch Andrew, Padovan-Merhar Olivia, Regev Aviv, Rinn John L, Raj Arjun. Genome Biology. 1. Vol. 16. BioMed Central Ltd; 2015. Localization and Abundance Analysis of Human lncRNAs at Single-Cell and Single-Molecule Resolution; p. 20. - PMC - PubMed
    1. Cote Allison J, McLeod Claire M, Farrell Megan J, McClanahan Patrick D, Dunagin Margaret C, Raj Arjun, Mauck Robert L. Nature Communications. March. Vol. 7. Nature Publishing Group; 2016. Single-Cell Differences in Matrix Gene Expression Do Not Predict Matrix Deposition; p. 10865. - PMC - PubMed
    1. Dijk David van, Nainys Juozas, Sharma Roshan, Kathail Pooja, Carr Ambrose J, Moon Kevin R, Mazutis Linas, Wolf Guy, Krishnaswamy Smita, Pe’er Dana. MAGIC: A Diffusion-Based Imputation Method Reveals Gene-Gene Interactions in Single-Cell RNA-Sequencing Data. bioRxiv. 2017 doi: 10.1101/111591. - DOI