. 2018 Apr;40(2):139-149.
doi: 10.1007/s11357-018-0011-5. Epub 2018 Feb 17.

The effect of different levels of dietary restriction on glucose homeostasis and metabolic memory

Affiliations

The effect of different levels of dietary restriction on glucose homeostasis and metabolic memory

Stephanie Matyi et al. Geroscience. 2018 Apr.

Abstract

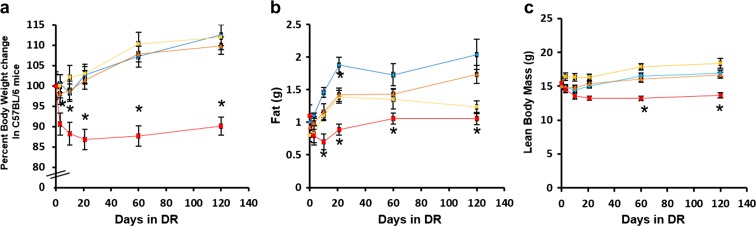
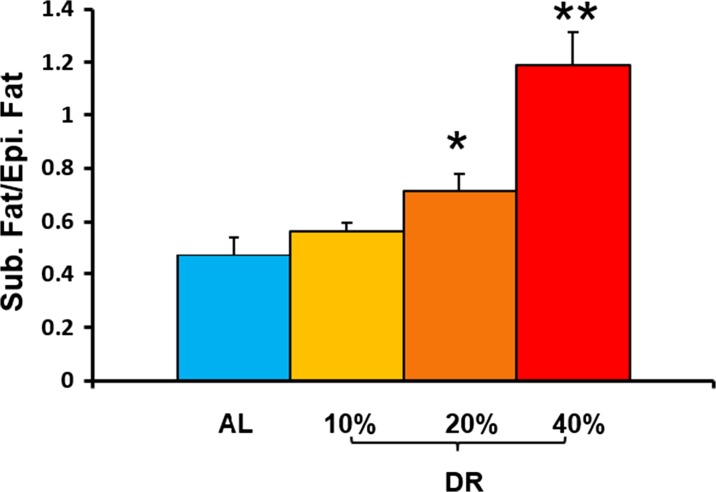
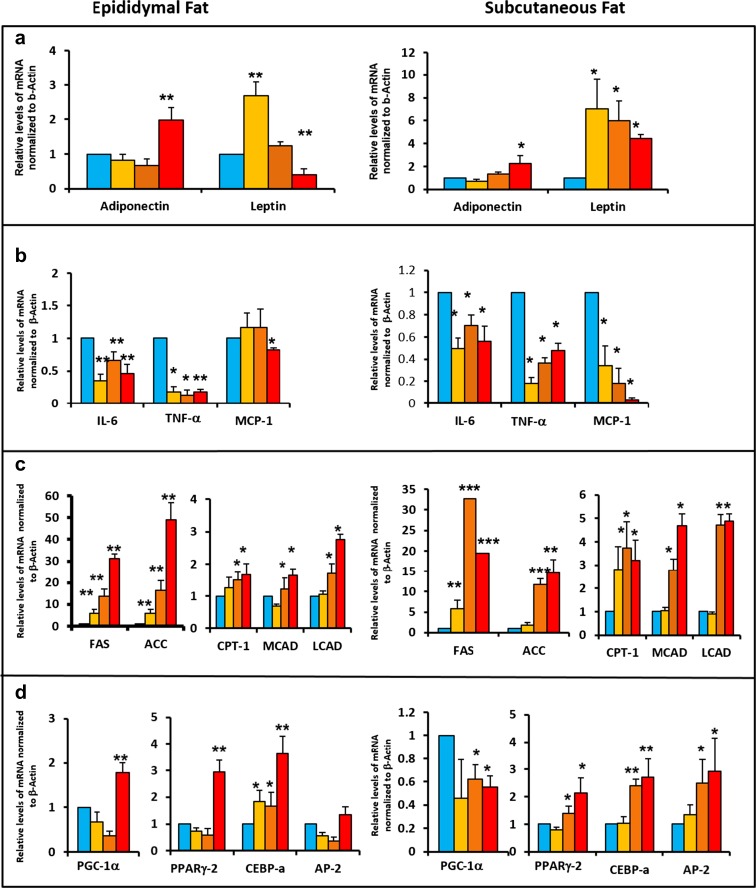
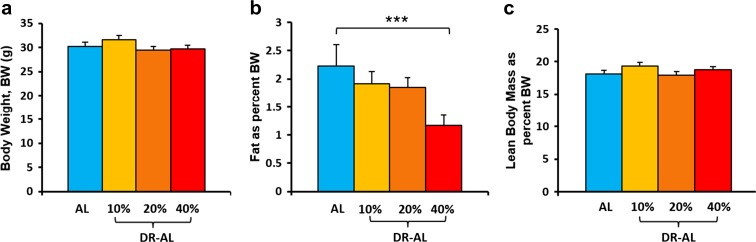
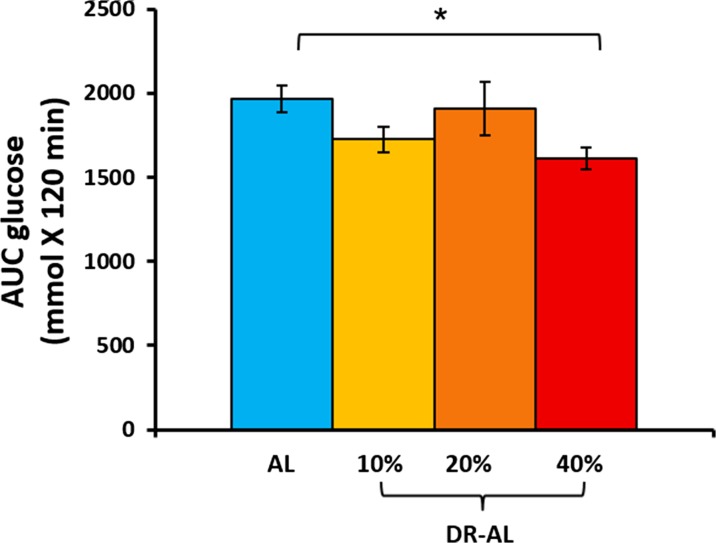
Over the past 50 years, dietary restriction (DR) has been shown to extend the life span of a wide variety of organisms. A hallmark feature of DR is improved glucose homeostasis resulting in increased glucose tolerance and insulin sensitivity of animals ranging from rodents to humans. In this study, we demonstrate the early effects of varying levels of DR on glucose tolerance. Within 10 days of 40% DR, glucose tolerance was significantly improved and by 120 days; 10 and 20% DR also showed enhanced glucose tolerance. All three levels of DR showed reduced adiposity, increased expression of genes involved in fat turnover, and a reduction in the expression for markers of inflammation. Studies have shown that mice fed a DR diet retained metabolic memory in terms of improved glucose tolerance even after DR is discontinued. We show that 40% DR not only has an early effect on glucose tolerance but also maintained it after DR was discontinued for 2 months. Therefore, improvement in glucose tolerance is brought about by all three levels of DR but the metabolic memory is not dose responsive.

Keywords: Adiposity; Dietary restriction; Gene expression; Glucose tolerance; Metabolic memory.


Figures

Fig. 1
Fig. 1
Effect of different levels of DR on body composition. The body weight (a), fat mass (b), and lean body mass (c) of mice on AL and different levels of DR (10, 20, 40%) were measured after 3, 10, 21, 60, and 120 days of DR. Color codes: blue—AL, yellow—10% DR, orange—20% DR, and red—40% DR. Data represented are the mean ± SEM from 10 mice per group and were statistically analyzed by one-way ANOVA with Tukey’s multiple correction test. The asterisk indicates the values that are significantly different (P < 0.05) from the AL mice
Fig. 2
Fig. 2
Effect of different levels of DR on ratio of epididymal (Epi) fat to subcutaneous (Sub) fat. The data represented are the mean ± SEM from five mice per group and were statistically analyzed by one-way ANOVA with Tukey’s multiple correction test. The asterisk indicates that the values are significantly different (P < 0.05) from the AL mice
Fig. 3
Fig. 3
Effect of different levels of DR on gene expression in epididymal and subcutaneous fat. a Expression of adiponectin and leptin in both epididymal and subcutaneous fat. b Expression of genes involved in inflammation (IL-6, TNF-a, MCP-1) in both epididymal and subcutaneous fat. c Expression of genes involved in fatty acid synthesis (FAS and ACC) and fatty acid breakdown (CPT-1, MCAD, LCAD) in epididymal and subcutaneous fat. d Expression of genes involved in mitochondrial biogenesis (PGC-1a) and adipocyte differentiation (PPARg-2, CEBP-a, AP-2) in epididymal and subcutaneous fat. Color codes: blue—AL, yellow—10% DR, orange—20% DR, and red—40% DR. The data represented are the mean ± SEM from three to five mice per group and were statistically analyzed by one-way ANOVA with Tukey’s multiple correction test. The asterisk indicates the values that are significantly different (P < 0.05) from the AL mice
Fig. 4
Fig. 4
Effect of different levels of DR on glucose tolerance (GTT). The graphs show the area under the curve (AUC) for the GTTs conducted for mice fed DR diets (10, 20, 40%) at 3, 10, 21, and 120 days after the start of DR. Data represented are the mean ± SEM from 10 mice per group except for the 120-day GTT, which had 5 mice per group and were statistically analyzed by one-way ANOVA with Tukey’s multiple correction test. The asterisk indicates the values that are significantly different (P < 0.05) from the AL mice for each of the times that glucose tolerance was measured
Fig. 5
Fig. 5
Effect of switching mice fed DR to AL on body composition. Mice fed different levels of DR (10, 20, and 40%) for 120 were fed AL for 2 months. The body weight (a), fat mass (b), and lean body mass (c) are the mean ± SEM from five mice per group and were statistically analyzed by one-way ANOVA with Tukey’s multiple correction test. The asterisk indicates the values that are significantly different (P < 0.05) from the AL mice
Fig. 6
Fig. 6
Effect of different levels of DR on glucose tolerance (GTT) after switch to AL diet (DR-AL). GTTs were done after an overnight fast for mice that had been fed the respective DR diets (10, 20, 40%) for 4 months and then fed AL for 2 months. The AUC of the GTTs are shown and are the mean ± SEM from 10 per group and were statistically analyzed by one-way ANOVA with Tukey’s multiple correction test. The asterisk indicates the values that are significantly different (P < 0.05) from the AL mice

References

    1. Bartke A, Wright JC, Mattison JA, Ingram DK, Miller RA, Roth GS. Extending the lifespan of long-lived mice. Nature. 2001;414(6862):412. doi: 10.1038/35106646. - DOI - PubMed
    1. Barzilai N, Banerjee S, Hawkins M, Chen W, Rossetti L. Caloric restriction reverses hepatic insulin resistance in aging rats by decreasing visceral fat. J Clin Invest. 1998;101(7):1353–1361. doi: 10.1172/JCI485. - DOI - PMC - PubMed
    1. Bruss MD, Khambatta CF, Ruby MA, Aggarwal I, Hellerstein MK. Calorie restriction increases fatty acid synthesis and whole body fat oxidation rates. Am J Physiol Endocrinol Metab. 2010;298(1):E108–E116. doi: 10.1152/ajpendo.00524.2009. - DOI - PMC - PubMed
    1. Cameron KM, Miwa S, Walker C, von Zglinicki T. Male mice retain a metabolic memory of improved glucose tolerance induced during adult onset, short-term dietary restriction. Longev Healthspan. 2012;1:3. doi: 10.1186/2046-2395-1-3. - DOI - PMC - PubMed
    1. Chau YY, Bandiera R, Serrels A, Martinez-Estrada OM, Qing W, Lee M, et al. Visceral and subcutaneous fat have different origins and evidence supports a mesothelial source. Nat Cell Biol. 2014;16(4):367–375. doi: 10.1038/ncb2922. - DOI - PMC - PubMed

Publication types