. 2018;14(3):437-449.
doi: 10.1080/15548627.2017.1419118. Epub 2018 Feb 17.

HEPES activates a MiT/TFE-dependent lysosomal-autophagic gene network in cultured cells: A call for caution

Affiliations

HEPES activates a MiT/TFE-dependent lysosomal-autophagic gene network in cultured cells: A call for caution

Marc J Tol et al. Autophagy. 2018.

Abstract

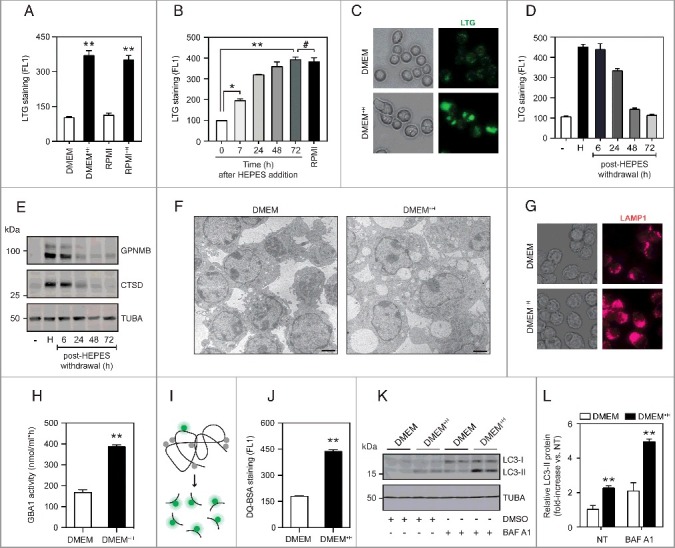
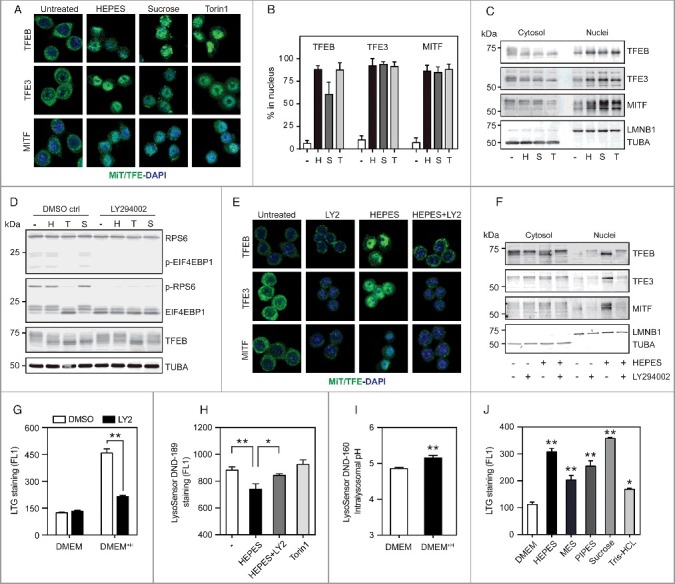
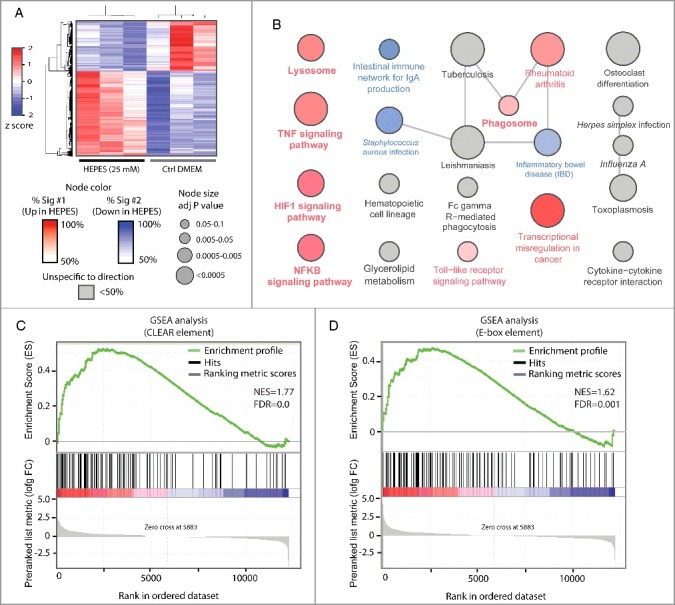
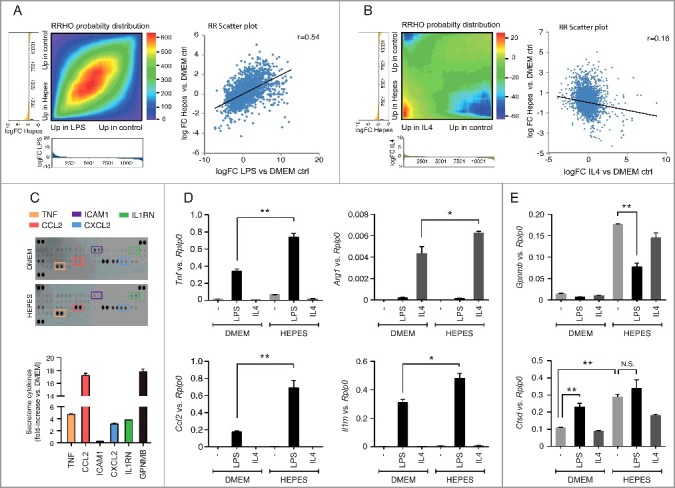
In recent years, the lysosome has emerged as a highly dynamic, transcriptionally regulated organelle that is integral to nutrient-sensing and metabolic rewiring. This is coordinated by a lysosome-to-nucleus signaling nexus in which MTORC1 controls the subcellular distribution of the microphthalmia-transcription factor E (MiT/TFE) family of "master lysosomal regulators". Yet, despite the importance of the lysosome in cellular metabolism, the impact of traditional in vitro culture media on lysosomal dynamics and/or MiT/TFE localization has not been fully appreciated. Here, we identify HEPES, a chemical buffering agent that is broadly applied in cell culture, as a potent inducer of lysosome biogenesis. Supplementation of HEPES to cell growth media is sufficient to decouple the MiT/TFE family members-TFEB, TFE3 and MITF-from regulatory mechanisms that control their cytosolic retention. Increased MiT/TFE nuclear import in turn drives the expression of a global network of lysosomal-autophagic and innate host-immune response genes, altering lysosomal dynamics, proteolytic capacity, autophagic flux, and inflammatory signaling. In addition, siRNA-mediated MiT/TFE knockdown effectively blunted HEPES-induced lysosome biogenesis and gene expression profiles. Mechanistically, we show that MiT/TFE activation in response to HEPES requires its macropinocytic ingestion and aberrant lysosomal storage/pH, but is independent of MTORC1 signaling. Altogether, our data underscore the cautionary use of chemical buffering agents in cell culture media due to their potentially confounding effects on experimental results.

Keywords: Autophagy, cell culture; HEPES; MTOR; MiT/TFE; lysosome; metabolism.


Figures

Figure 1.
Figure 1.
HEPES drives lysosomal biogenesis in cultured RAW264.7 macrophages. (A) Flow cytometric analysis (FL1) of LTG-stained RAW cells grown in either DMEM (31966), DMEM (32430; containing HEPES), RPMI (61870), or RPMI (22409; containing HEPES). (B) Time-course analysis of LTG staining in cells grown in DMEM supplemented with HEPES (25 mM) for 6–72 h. RPMI-grown cells served as a positive control. (C) Fluorescence microscopy analysis of LTG-stained RAW cells cultured in DMEM or DMEM+H for 24 h. (D-E) RAW cells were adapted to grow in DMEM (32430; containing HEPES) for 7 d, after which culture media were replaced by HEPES-free DMEM (31966) for 6–72 h. A time course for (D) LTG staining and (E) Immunoblot analysis of GPNMB and CTSD protein levels. (F) Transmission electron microscopy (TEM) analysis of RAW cells grown in either DMEM or DMEM+H for 24 h. Scale bar: 1 µm. (G) Phase-contrast and immunofluorescence microscopy analysis of LAMP1-stained cells. (H) Analysis of GBA1 enzymatic activity using a 4-MU-based assay in RAW cells grown in DMEM or DMEM+H for 24 h. (I) Schematic illustration of the DQ-BSA reagent used for quantifying lysosomal proteolytic activity. DQ-BSA added to culture media is rapidly endocytosed, but only emits a fluorescent signal after cleavage by proteases inside lysosomes. (J) Flow cytometric analysis of DQ-BSA cleavage (FL1) in RAW cells grown in DMEM or DMEM+H for 24 h. (K) Western blot analysis and (L) quantification of LC3-II protein levels in RAW cells grown in DMEM or DMEM+H for 24 h, and where indicated treated with bafilomycin A1 (BAF A1; 100 nM) for the last 2 h. Values are expressed as mean ± SEM, n = 3-4 in A-L. **P<0.01.
Figure 2.
Figure 2.
HEPES promotes MiT/TFE nuclear translocation independent of MTORC1 activity. (A) Representative images and (B) quantified MiT/TFE nuclear import in RAW cells treated with HEPES (H), sucrose (S), or Torin1 (T) for 6 h, stained for endogenous TFEB, TFE3, or MITF levels (in green) and counterstained with DAPI (in blue). Values are expressed as percent of cells counted (>100 per experiment). (C) Western blot analysis on cytosolic and nuclear fractions isolated from RAW macrophages treated for 6 h, as indicated. Membranes were probed with antibodies against MiT/TFE family members. TUBA and LMNB1 were used as controls for the cytosolic and nuclear fractions, respectively. (D) HEPES and sucrose supplementation to RAW cell culture media does not inhibit MTORC1 signaling. Western blot analysis on protein extracts isolated from RAW cells treated for 6 h as indicated in the presence and absence of the PtdIns3K inhibitor LY294002 (LY2; 50 µM). Membranes were probed with antibodies against p-EIF4EBP1 (Thr37/46), p-RPS6 (Ser235/236), and TFEB. (E-G) LY2 prevents HEPES-dependent MiT/TFE nuclear redistribution and lysosome biogenesis. (E) Representative images and (F) western blot analysis of MiT/TFE relocalization in RAW cells pretreated with LY2 for 30 min and subsequently cultured in either DMEM or DMEM+H for 6 h. (G) Flow cytometric analysis of LTG-stained cells pre-treated with LY2 and grown in DMEM or DMEM+H for another 16 h. (H-I) HEPES perturbs lysosomal pH/acidification. (H) Flow cytometric analysis of fluorescent intensity (FL1) in LysoSensor™ DND-189 stained RAW cells treated for 2 h, as indicated. (I) Quantified lysosomal pH using LysoSensor™ Yellow/Blue DND-160 in cells grown in DMEM or DMEM+H for 4 h. (J) Flow cytometric analysis of LTG-stained RAW cells grown in DMEM supplemented with HEPES (20 mM), MES (20 mM), PIPES (10 mM), sucrose (80 mM), and Tris-HCl (20 mM) for 16 h. Values are expressed as mean ± SEM, n = 3-4 in A-J. *P < 0.05, **P < 0.01.
Figure 3.
Figure 3.
Global molecular consequence of HEPES on the RAW264.7 macrophage cell line. (A) A heatmap transformation of the z-score normalized levels of the top ∼1738 differentially expressed genes (log FC>|0.5| with adj p-value of <0.01) following HEPES supplementation to RAW cell culture media for 24 h. (B) Kyoto Encyclopedia of Genes and Genomes (KEGG) pathway enrichment analysis on 2 lists with either up- or downregulated genes in response to HEPES. Node color indicates cellular pathways that were mostly enriched in upregulated (more red) or downregulated (more blue) genes or nonspecific to direction of the expression change (gray). (C-D) HEPES drives a MiT/TFE-mediated gene signature in RAW cells. Gene set enrichment analysis (GSEA) on the RAW transcriptome following exposure to HEPES for 24 h. Graphs show enrichment plots of ranked gene expression data (red, upregulated; blue, downregulated). The enrichment score is depicted as a green line, and the vertical black bars below indicate the position of lysosomal-autophagic and innate host-immune response genes carrying either validated (C) CLEAR sequences bound by TFEB, or (D) E-box consensus motifs bound by TFE3.
Figure 4.
Figure 4.
HEPES affects host-immune gene programs in RAW macrophages. (A-B) Rank-rank hypergeometric overlap (RRHO) analysis comparing the gene ranking (log FC) affected by HEPES (relative to DMEM) to an (A) M1 polarization state induced by LPS (100 ng/ml), or an (B) M2-specific state induced by IL4 (50 ng/ml). Pixel values in the RRHO map represent the log10-transformed hypergeometric overlap of subsections of 2 ranked gene lists (step size 100 genes). Red values indicate a higher than expected number of overlapping genes in the subsections, and blue values signify a lower than expected overlapping gene number. Below the heatmaps, the metric values (log FC) used for the differential expression levels are plotted in a bar graph along x- and y-axes. A scatter plot (A-B) of the datasets is shown for comparing the RRHO map to a standard metric of correlation (Pearson). The RRHO result and Pearson correlation coefficient reflect a similar relationship. (C) Cytokine array blots on culture media derived from DMEM or DMEM+H-grown cells for 24 h. Secreted cytokines and chemokines in culture media were detected using a Mouse Cytokine Array kit and quantified with the Odyssey V3.0 software (fold-increase relative to DMEM ctrl). Secreted GPNMB levels were measured as a positive control. (D-E) RT-PCR analysis of the specified (D) M1- and M2-specific markers and (E) MiT/TFE target genes in RAW cells grown in DMEM or DMEM+H for 24 h and pulsed with either vehicle Ctrl (-), LPS (100 ng/ml) or IL4 (50 ng/ml) for another 24 h. Gene expression was normalized to Rplp0. Values are expressed as mean ± SEM, n = 3-4 in A-E. *P < 0.05, **P < 0.01. N.S., nonsignificant.

Similar articles

Cited by

References

    1. De Duve C, Pressman BC, Gianetto R, et al. . Tissue fractionation studies. 6. Intracellular distribution patterns of enzymes in rat-liver tissue. Biochem J. 1955 Aug;60(4):604–617. PubMed PMID: 13249955; PubMed Central PMCID: PMC1216159. doi:10.1042/bj0600604. - DOI - PMC - PubMed
    1. Settembre C, Fraldi A, Medina DL, et al. . Signals from the lysosome: a control centre for cellular clearance and energy metabolism. Nat Rev Mol Cell Biol. 2013 May;14(5):283–296. doi: 10.1038/nrm3565 PubMed PMID: 23609508; PubMed Central PMCID: PMC4387238. - DOI - PMC - PubMed
    1. Bar-Peled L, Sabatini DM. Regulation of mTORC1 by amino acids. Trends Cell Biol. 2014 Jul;24(7):400–406. doi: 10.1016/j.tcb.2014.03.003 PubMed PMID: 24698685; PubMed Central PMCID: PMCPMC4074565. - DOI - PMC - PubMed
    1. Meijer AJ, Codogno P. Autophagy: regulation and role in disease. Crit Rev Clin Lab Sci. 2009;46(4):210–240. doi: 10.1080/10408360903044068 PubMed PMID: 19552522. - DOI - PubMed
    1. Aerts JM, Hollak C, Boot R, et al. . Biochemistry of glycosphingolipid storage disorders: implications for therapeutic intervention. Philos Trans R Soc Lond B Biol Sci. 2003 May 29;358(1433):905–914. doi: 10.1098/rstb.2003.1273 PubMed PMID: 12803924; PubMed Central PMCID: PMC1693181. - DOI - PMC - PubMed

Publication types

MeSH terms

Substances