. 2020 Sep;11(5):354-370.
doi: 10.1080/21541248.2017.1413496. Epub 2018 Feb 17.

Acute compressive stress activates RHO/ROCK-mediated cellular processes

Affiliations

Acute compressive stress activates RHO/ROCK-mediated cellular processes

Sarah T Boyle et al. Small GTPases. 2020 Sep.

Abstract

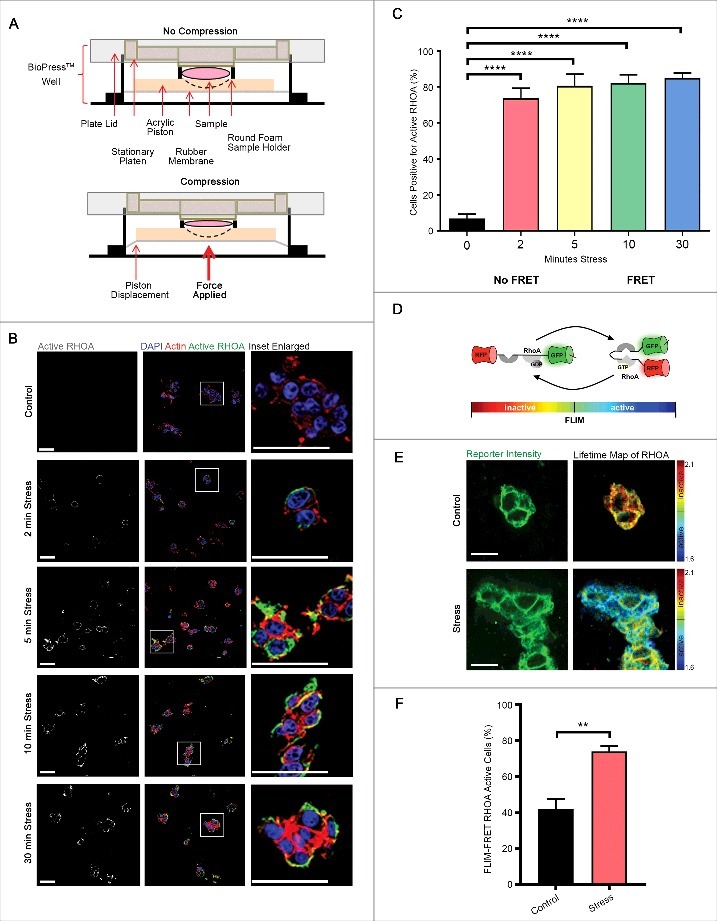
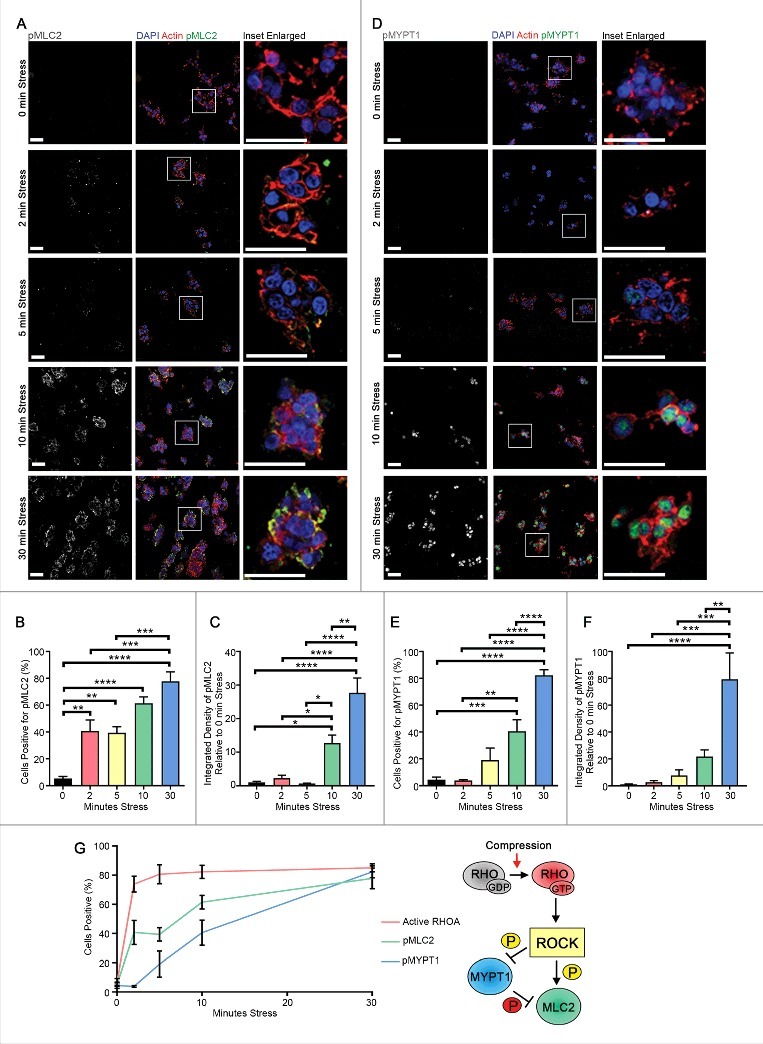
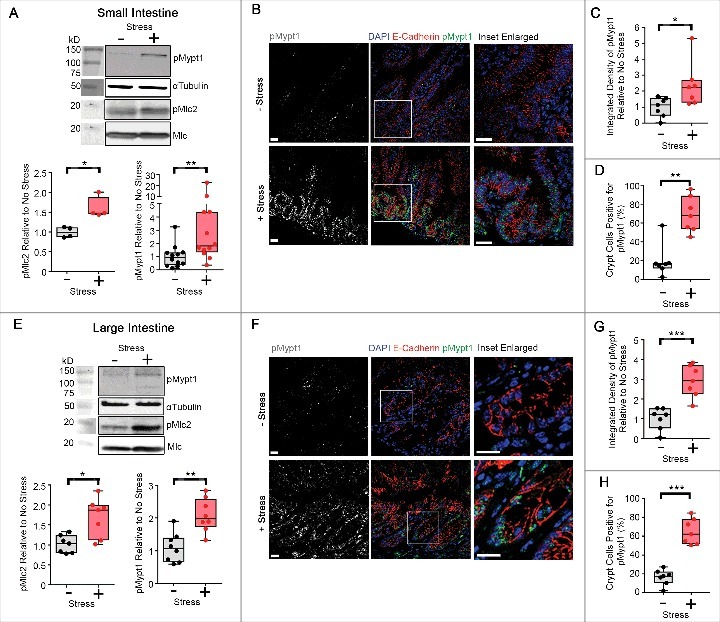
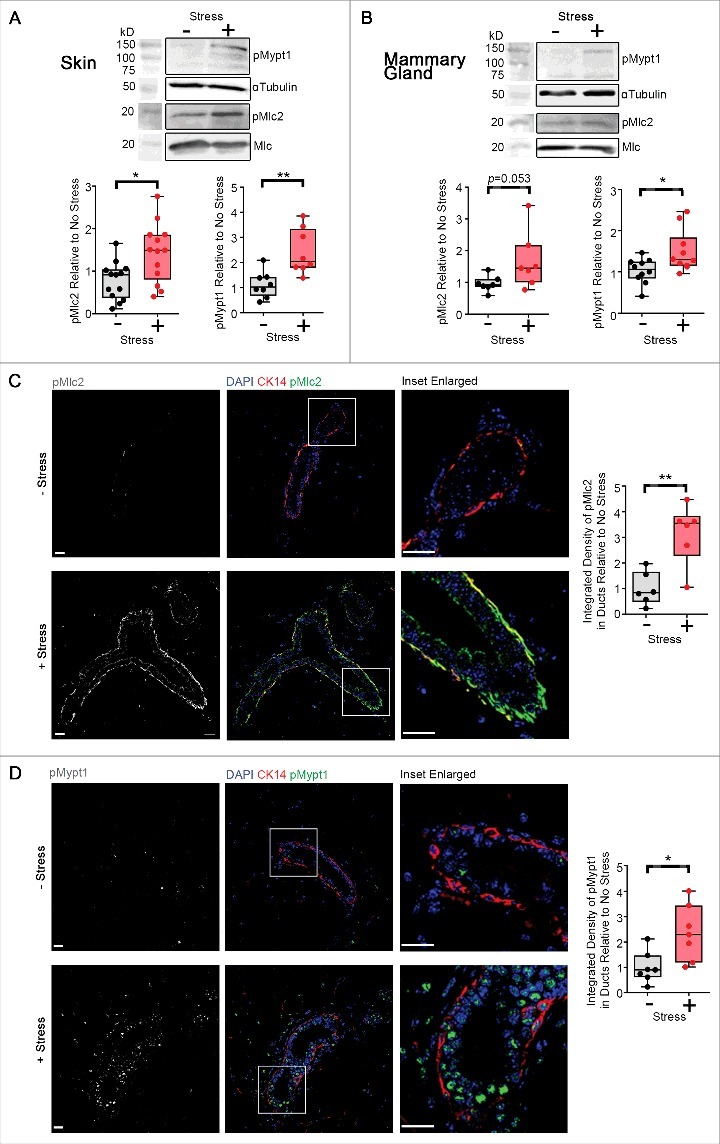
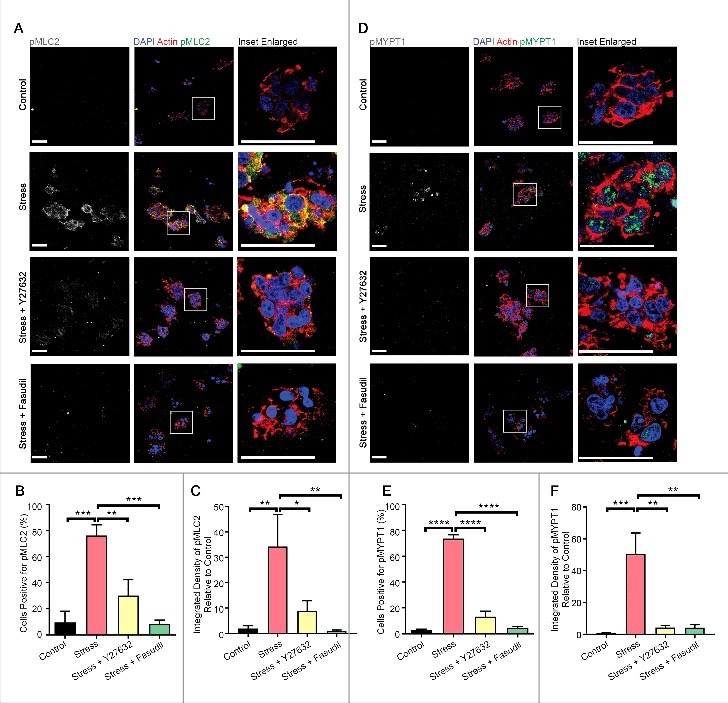
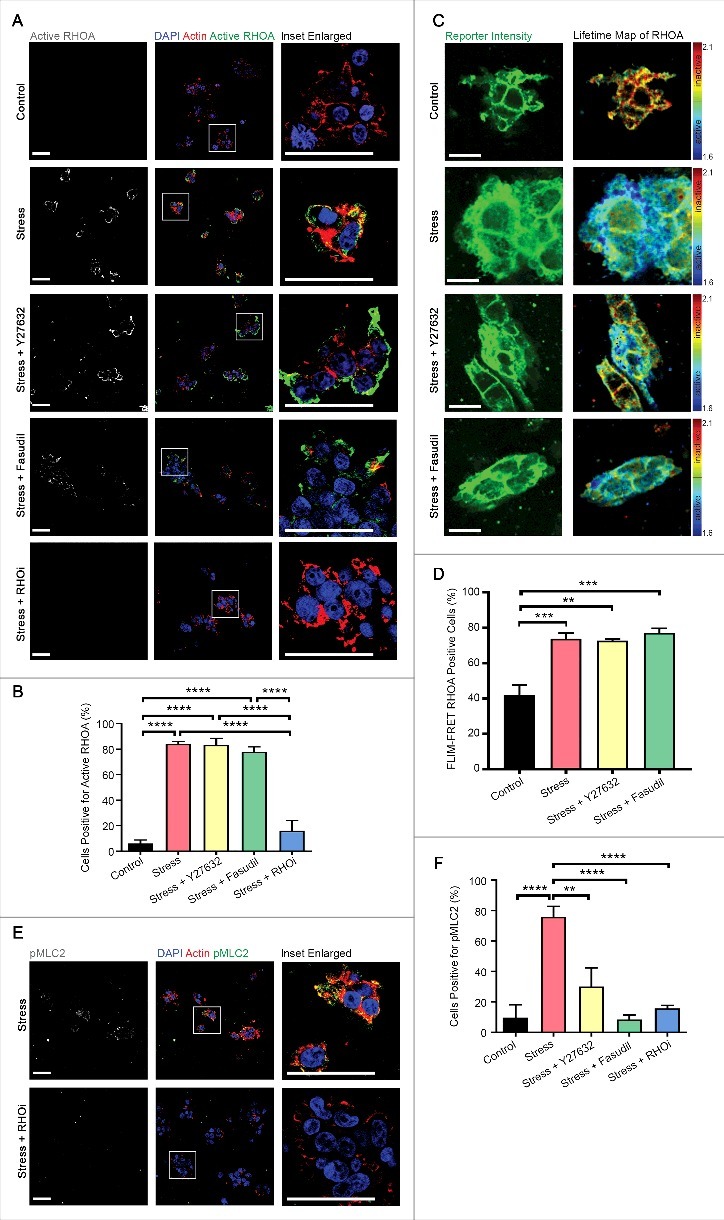
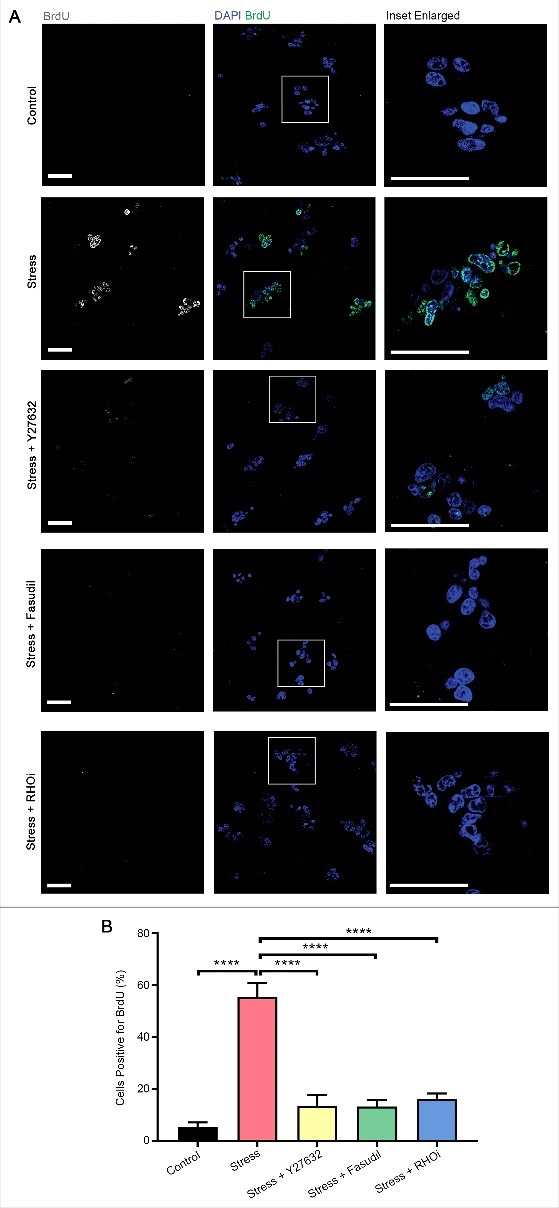
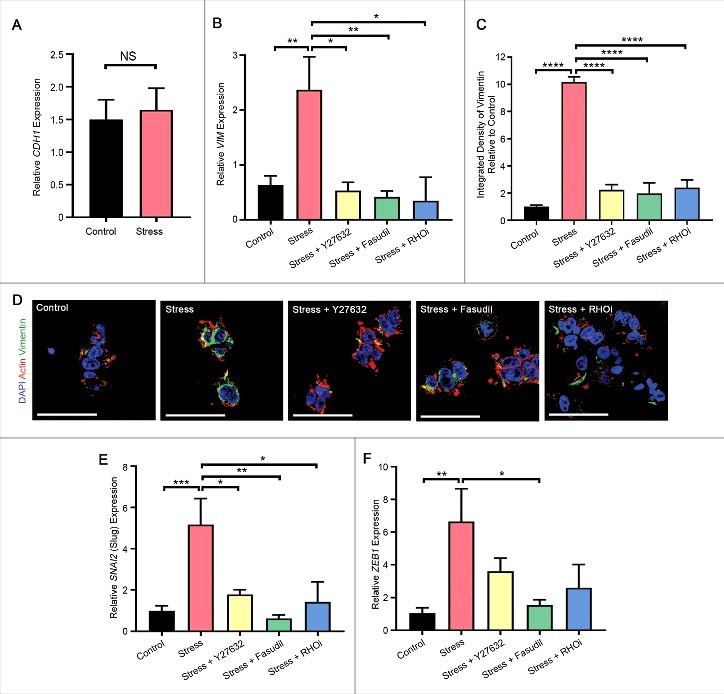
The ability to rapidly respond to applied force underpins cell/tissue homeostasis. This response is mediated by mechanotransduction pathways that regulate remodeling and tension of the actomyosin cytoskeleton to counterbalance external forces. Enhanced extracellular matrix tension hyper-activates mechanotransduction and characterizes diseased states such as cancer, but is also required for normal epidermal regeneration. While the impact of extracellular matrix tension on signaling and cell biology are well appreciated, that of acute compressive force is under-studied. We show here that acute compressive force applied to cells and tissues in a native 3-dimensional context elevates RHOA-GTP levels and increases regulatory myosin phosphorylation, actomyosin contractility and tension via ROCK. In consequence, cell proliferation was increased, as was the expression of regulators of epithelial-mesenchymal transition. Pharmacological inhibition of ROCK abrogated myosin phosphorylation, but not RHOA activation. Our results strongly suggest that acute compressive stress impairs cellular homeostasis in a RHO/ROCK-dependent manner, with implications for disease states such as cancer.

Keywords: RHOA; ROCK; actomyosin tension; compressive stress; cytoskeleton; extracellular matrix (ECM); mechanical signaling; mechano-reciprocity.


Figures

Figure 1.
Figure 1.
RHOA is activated by compressive stress. (A) Diagram of how compressive stress was applied to cells embedded in collagen matrices, and to whole mouse tissues. (B-C) Immunofluorescence analysis of GTP-bound RHOA (white in monochrome and green in merge), as detected by a conformation-specific anti-Active RHOA antibody, in HEK-293T cells embedded in collagen followed by application of compressive stress for times as specified. F-actin is labelled with phalloidin and cell nuclei with DAPI (red and blue in merge). Scale Bars: 50 µm. Column graph shows percentage of cells positive. n = 5 collagen matrices per analysis and data (mean+SEM) were graphed by averaging multiple fields of view and analyzed by one-way ANOVA. ****p < 0.0001. (D) Schematic representation of the principle of Förster resonance energy transfer (FRET) using the Raichu RHOA-FRET biosensor. (E) Representative images of collagen-embedded HEK-293T-RHOA-FRET cells (green) following compressive stress for 10 minutes, with corresponding lifetime map of RHOA FRET. Scale Bars: 20 µm. (F) HEK-293T-RHOA-FRET cells were subjected to compressive stress for 10 minutes and percent of FLIM-FRET RHOA active cells quantified. n = 3 collagen matrices per analysis and data (mean+SEM) were analyzed by unpaired t-test. **p < 0.01.
Figure 2.
Figure 2.
Compressive stress progressively elevates actomyosin tension. Immunofluorescence analysis of p(Ser19)MLC2 (A-C) and p(Thr696)MYPT1 (D-F) (white in monochrome and green in merge) of HEK-293T cells embedded in collagen followed by application of compressive stress for time points as indicated. F-actin is labelled with phalloidin and cell nuclei with DAPI (red and blue in merge). Scale Bars: 50 µm. Column graphs show percentage of cells positive and level of integrated density relative to no stress. n = 5-7 collagen matrices per analysis and data (mean+SEM) were graphed by averaging multiple fields of view and analyzed by one-way ANOVA. *p < 0.05, **p < 0.01, ***p < 0.001, ****p < 0.0001. (G) Time-course of RHO/ROCK signaling activation (mean±SEM) upon compression and inferred sequence of signaling events.
Figure 3.
Figure 3.
Compressive stress elevates actomyosin tension in freshly dissected mouse intestinal tissues. (A) Western analysis of p(Thr18/Ser19)Mlc2 (n = 4 mice) and p(Thr696)Mypt1 (n = 12 mice) in epithelial cell lysates derived from proximal murine small intestinal tissue subjected to compressive stress. Box and whisker plots show relative band intensities. (B-D) Immunofluorescence analysis (B) of p(Thr696)Mypt1 (white in monochrome and green in merge) in small intestinal tissues (n = 7 mice) subjected to compressive stress. Cell junctions are labelled with E-Cadherin and cell nuclei are labelled with DAPI (red and blue in merge). Scale Bars: 20 µm. Box and whisker plots show level of integrated density relative to no stress (C) and percentage of crypt cells positive (D), and were graphed by averaging multiple fields of view. (E) Western analysis of p(Thr18/Ser19)Mlc2 (n = 7 mice) and p(Thr696)Mypt1 (n = 8 mice) in epithelial cell lysates derived from murine large intestinal tissue subjected to compressive stress. Box and whisker plots show relative band intensities. (F-H) Immunofluorescence analysis (F) of p(Thr696)Mypt1 (white in monochrome and green in merge) in large intestinal tissues (n = 7 mice) subjected to compressive stress. Cell junctions are labelled with E-Cadherin and cell nuclei are labelled with DAPI (red and blue in merge). Scale Bars: 20 µm. Box and whisker plots show level of integrated density relative to no stress (G) and percentage of crypt cells positive (H), and were graphed by averaging multiple fields of view. (A-H) Data (median±IQR) were analyzed by the Mann-Whitney test. *p < 0.05, **p < 0.01, ***p < 0.001.
Figure 4.
Figure 4.
Compressive stress elevates actomyosin tension in freshly dissected mouse skin and mammary tissues. (A) Western analysis of p(Thr18/Ser19)Mlc2 (n = 13 mice) and p(Thr696)Mypt1 (n = 8 mice) in skin tissue subjected to compressive stress. Box and whisker plots show relative band intensities. (B) Western analysis of p(Thr18/Ser19)Mlc2 (n = 7 mice) and p(Thr696)Mypt1 (n = 10 mice) in mammary gland tissue subjected to compressive stress. Box and whisker plots show relative band intensities. (C-D) Immunofluorescence analysis of p(Ser19)Mlc2 (n = 6 mice) (C) and p(Thr696)Mypt1 (n = 7 mice) (D) (white in monochrome and green in merge) in mammary gland tissue subjected to compressive stress. Basal cells are labelled with cytokeratin-14 and cell nuclei are labelled with DAPI (red and blue in merge). Scale Bars: 20 µm. Box and whisker plots show level of integrated density relative to no stress, and were graphed by averaging multiple fields of view. (A-D) Data (median±IQR) were analyzed by the Mann-Whitney test. *p < 0.05, **p < 0.01.
Figure 5.
Figure 5.
Compression-induced enhancement of actomyosin tension requires ROCK kinase activity. Immunofluorescence analysis of p(Ser19)MLC2 (A-C) and p(Thr696)MYPT1 (D-F) (white in monochrome and green in merge) in HEK-293T cells embedded in collagen followed by application of compressive stress with and without pre-treatment with the ROCK-specific kinase inhibitors Y27632 and Fasudil. F-actin is labelled with phalloidin and cell nuclei with DAPI (red and blue in merge). Scale Bars: 50 µm. Column graphs show percentage of cells positive and level of integrated density relative to no stress. n = 5-7 collagen matrices per analysis and data (mean+SEM) were graphed by averaging multiple fields of view and analyzed by one-way ANOVA. *p < 0.05, **p < 0.01, ***p < 0.001, ****p < 0.0001.
Figure 6.
Figure 6.
Compression-induced enhancement of RHO signaling can be blocked pharmacologically. (A-B) Immunofluorescence analysis of GTP-bound active RHOA (white in monochrome and green in merge), as detected by a conformation-specific anti-Active RHOA antibody, in HEK-293T cells embedded in collagen followed by application of compressive stress with and without pre-treatment with the ROCK-specific inhibitors Y27632 and Fasudil, and a RHO-specific inhibitor (RHOi). F-actin is labelled with phalloidin and cell nuclei with DAPI (red and blue in merge). Scale Bars: 50 µm. Column graph shows percentage of cells positive. n = 5-7 collagen matrices per analysis and data (mean+SEM) were graphed by averaging multiple fields of view and analyzed by one-way ANOVA. ****p < 0.0001. (C) Representative images of collagen-embedded HEK-293T-RHOA-FRET cells (green) followed by application of compressive stress for 10 minutes with and without pre-treatment with the ROCK-specific inhibitors Y27632 and Fasudil, with corresponding lifetime map of RHOA FRET. Scale Bars: 20 µm. (D) HEK-293T-RHOA-FRET cells were subjected to compressive stress for 10 minutes with and without pre-treatment with the ROCK-specific inhibitors Y27632 and Fasudil and percent of FLIM-FRET RHOA active cells quantified. Data is combined with that in Fig. 1F. n = 3 collagen matrices per analysis and data (mean+SEM) were analyzed by one-way ANOVA. **p < 0.01. ***p < 0.001. (E-F) p(Ser19)MLC2 (white in monochrome and green in merge) in HEK-293T cells embedded in collagen followed by application of compressive stress with and without pre-treatment with RHOi. Data in F is combined with that in Fig. 5B. F-actin is labelled with phalloidin and cell nuclei with DAPI (red and blue in merge). Scale Bars: 50 µm. Column graph shows percentage of cells positive. n = 5-7 collagen matrices per analysis and data (mean+SEM) were graphed by averaging multiple fields of view and analyzed by one-way ANOVA. **p < 0.01, ****p < 0.0001.
Figure 7.
Figure 7.
Compression induces long-term effects on cellular proliferation. (A) Immunofluorescence analysis of bromodeoxyuridine (BrdU, white in monochrome and green in merge) incorporation in HEK-293T cells embedded in collagen followed by application of compressive stress with and without pre-treatment with the ROCK-specific inhibitors Y27632 and Fasudil and a RHO-specific inhibitor (RHOi). Cells were cultured in starvation conditions for a further 16 hours before pulsing with BrdU for analysis. Cell nuclei are labelled with DAPI (blue in merge). Scale Bars: 50 µm. (B) Column graph shows percentage of cells positive for BrdU incorporation. n = 8 collagen matrices per analysis and data (mean+SEM) were graphed by averaging multiple fields of view and analyzed by one-way ANOVA. ****p < 0.0001.
Figure 8.
Figure 8.
Compression induces long-term effects on mesenchymal gene and protein expression. (A) Gene expression (assessed by quantitative PCR) of epithelial marker CDH1 (E-Cadherin) in HEK-293T cells embedded in collagen followed by application of compressive stress. Data were analyzed by unpaired t-test. (B-D) Gene (assessed by quantitative PCR) (B) and protein (assessed by immunofluorescence analysis) (C-D) expression of mesenchymal marker VIM/Vimentin in HEK-293T cells embedded in collagen followed by application of compressive stress with and without pre-treatment with the ROCK-specific inhibitors Y27632 and Fasudil, and a RHO inhibitor (RHOi). For immunofluorescence analysis, cells were cultured a further 16 hours to detect changes in protein (shown in green, with F-actin labelled with phalloidin and cell nuclei with DAPI (red and blue)). Scale Bars: 50 µm, n = 3 collagen matrices per analysis. Data were analyzed by one-way ANOVA. *p < 0.05, **p < 0.01, ****p < 0.0001. (E-F) Gene expression of mesenchymal markers SNAI2 (Slug) (E) and ZEB1 (F) in HEK-293T cells embedded in collagen followed by application of compressive stress with and without pre-treatment with the ROCK-specific inhibitors Y27632 and Fasudil, and a RHO inhibitor (RHOi). Data were analyzed by one-way ANOVA. *p < 0.05, **p < 0.01, ***p < 0.001. (A-B, E-F) Cells were cultured for a further 2 hours to allow detection of changes in gene expression and are normalized to ribosomal 18S (n = 10 collagen matrices per analysis), All data (mean+SEM) are relative to no stress.

Similar articles

Cited by

References

    1. Boyle ST, Samuel MS.. Mechano-reciprocity is maintained between physiological boundaries by tuning signal flux through the Rho-associated protein kinase. Small GTPases. 2016;7(3):139–46. doi:10.1080/21541248.2016.117377110.1080/21541248.2016.1173771. PMID:27168253 - DOI - PMC - PubMed
    1. Butcher DT, Alliston T, Weaver VM. A tense situation: forcing tumour progression. Nat Rev Cancer. 2009;9:108–22. doi:10.1038/nrc254410.1038/nrc2544. PMID:19165226 - DOI - PMC - PubMed
    1. Carvalho RS, Scott JE, Yen EH. The effects of mechanical stimulation on the distribution of beta 1 integrin and expression of beta 1-integrin mRNA in TE-85 human osteosarcoma cells. Arch Oral Biol. 1995;40:257–64. doi:10.1016/0003-9969(95)98814-F10.1016/0003-9969(95)98814-F. PMID:7541624 - DOI - PubMed
    1. Cohen HJ, Laszlo J. Influence of trauma on the unusual distribution of metastases from carcinoma of the larynx. Cancer. 1972;29:466–71. doi:10.1002/1097-0142(197202)29:2<466::AID-CNCR2820290234>3.0.CO;2-M10.1002/1097-0142(197202)29:2<466::AID-CNCR2820290234>3.0.CO;2-M. PMID:5013548 - DOI - PubMed
    1. De Witt MT, Handley CJ, Oakes BW, et al. . In vitro response of chondrocytes to mechanical loading. The effect of short term mechanical tension. Connective Tissue Res. 1984;12:97–109. doi:10.3109/0300820840899277510.3109/03008208408992775. - DOI - PubMed

Publication types