. 2018 Feb 19;17(1):47.
doi: 10.1186/s12943-018-0787-z.

CCL2/CCL5 secreted by the stroma induce IL-6/PYK2 dependent chemoresistance in ovarian cancer

Affiliations

CCL2/CCL5 secreted by the stroma induce IL-6/PYK2 dependent chemoresistance in ovarian cancer

Jennifer Pasquier et al. Mol Cancer. .

Abstract

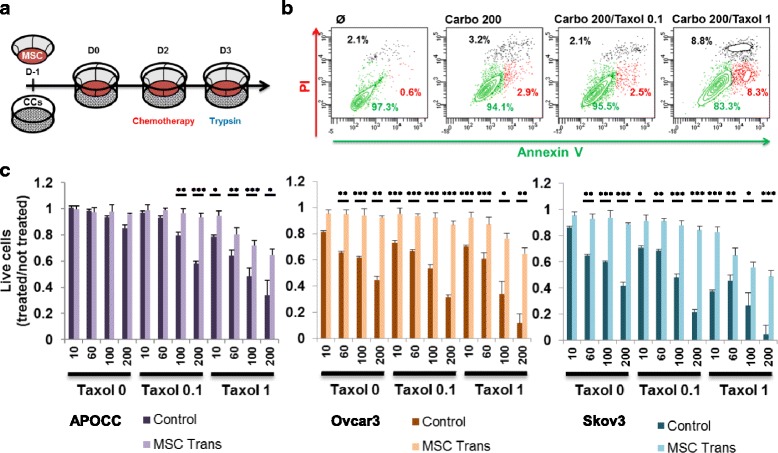
Background: Minimal residual disease is the main issue of advanced ovarian cancer treatment. According to the literature and previous results, we hypothesized that Mesenchymal Stromal Cells (MSC) could support this minimal residual disease by protecting ovarian cancer cells (OCC) from chemotherapy. In vitro study confirmed that MSC could induce OCC chemoresistance without contact using transwell setting. Further experiments showed that this induced chemoresistance was dependent on IL-6 OCC stimulation.

Methods: We combined meticulous in vitro profiling and tumor xenograft models to study the role of IL-6 in MSC/OCC intereactions.

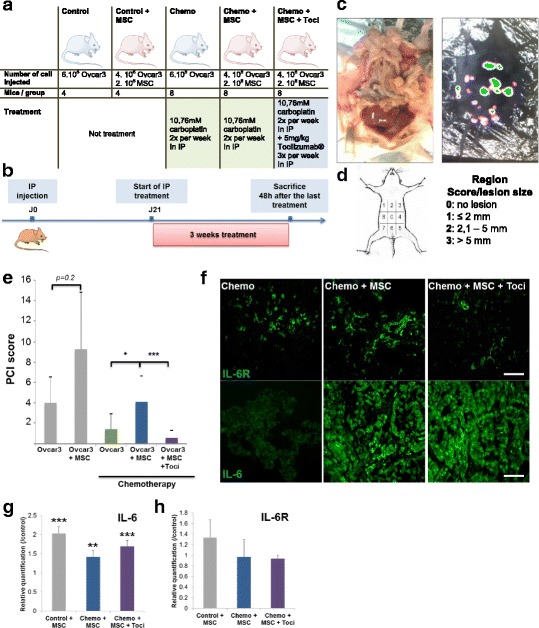
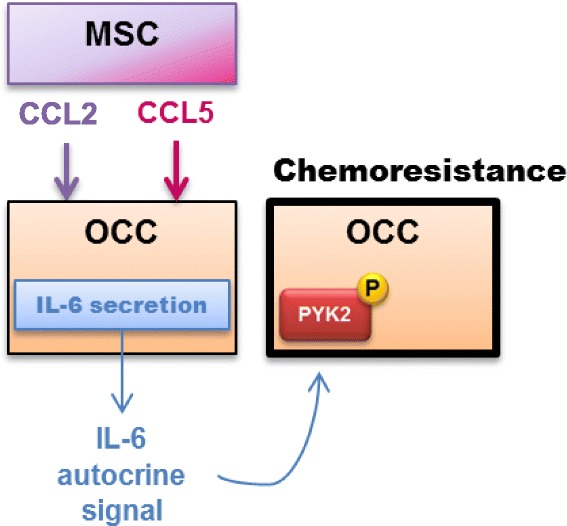
Results: We demonstrated that Tocilizumab® (anti-IL-6R therapy) in association with chemotherapy significantly reduced the peritoneal carcinosis index (PCI) than chemotherapy alone in mice xenografted with OCCs+MSCs. Further experiments showed that CCL2 and CCL5 are released by MSC in transwell co-culture and induce OCCs IL-6 secretion and chemoresistance. Finally, we found that IL-6 induced chemoresistance was dependent on PYK2 phosphorylation.

Conclusions: These findings highlight the potential key role of the stroma in protecting minimal residual disease from chemotherapy, thus favoring recurrences. Future clinical trials targeting stroma could use anti-IL-6 therapy in association with chemotherapy.

Keywords: Chemoresistance; Il-6; Mesenchymal stromal cell; Mouse; Ovarian cancer.


Conflict of interest statement

Competing interests

Dr. C. Touboul declares that he has occasionally acted as a consultant for TWA-ADELPHI. The other authors declare that they have no competing interests.

Publisher’s Note

Springer Nature remains neutral with regard to jurisdictional claims in published maps and institutional affiliations.

Figures

Fig. 1
Fig. 1
a. At D-1, MSC were plated on a transwell and ovarian cancer cells (OCCs) on a well itself. At D0, MSC and OCCs were put in contact. At D2 the chemotherapy were added for 24 h. At D3, cells were harvested for analysis. b. MSC were treated with Carboplatin (200 μM) or with a combination of Carboplatin (200 μM) and Taxol (0.1 μM or 1 μM) for 24 h. MSC were stained with PI and Annexin V, percentage of live cells (Annexin V/PI, green gate), apoptotic cells (Annexin V+, PI, red gate) and dead cells (Annexin V+/PI+, black gate) are represented for each conditions. c. After the experiment described in A., cells were counted using trepan blue. Histograms represent the ratio of living cells when treated with chemotherapy (100 μM carboplatin, 0.1 μM Taxol) divided by the number of living untreated cells. Mean (±SEM) of 3 different experiments. p < 0.05 (*), p < 0.01 (**) or p < 0.001 (***)
Fig. 2
Fig. 2
a. At D-1, MSC are plated on a transwell and OCCs on a well itself. At D0, MSC and OCCs are put in contact (control and removed) or not (Ø incubation) with the OCCs. At D2, MSC are kept on OCCs (control), or added to OCCs (Ø incubation) or removed from OCCs (removed) and the chemotherapy (100 μM carboplatin, 0.1 μM Taxol) is added for 24 h. At D3, cells were harvested. b. OCCs were treated with Carboplatin (100 μM) and Taxol (0.1 μM) for 24 h. Prior to the treatment OCCs were either culture alone (control) or 48 h with MSC (Removed). At the moment of the chemotherapy treatment MSC were removed or added to assess the role of the MSC incubation (Ø incubation). Histograms represent the percentage of living cells compared to the untreated cells. Mean (±SEM) of 3 different experiments. p < 0.05 (*), p < 0.01 (**) or p < 0.001 (***). c. OCCs were incubated or not with IL-6 (50 ng/ml) for 48 h following by chemotherapy treatment of Carboplatin (100 μM) and Taxol (0.1 μM) for 24 h. OCCs were harvested and stained with PI and Annexin V. The gates had been drawn as in B for each conditions on the plot. d. OCCs alone or in transwell with MSC (Trans) were incubated or not with a blocking antibody against IL-6 (20 μg/mL) for 48 h following by chemotherapy treatment of Carboplatin (200 μM) and Taxol (0.1 μM) for 24 h. OCCs were harvested and stained with PI and Annexin V. The gates had been drawn as in B for each conditions on the plot. p < 0.05 (*), p < 0.01 (**) or p < 0.001 (***)
Fig. 3
Fig. 3
a. The table displays the number and type of cell injected, the number of mice and treatment for each group used for the xenograph experiment. b. Schematic representation of xenograph experiment time line. c. Representative picture of the ovarian peritoneal carcinosis seen after sacrifice of the mice (left picture). Representative picture of the bioluminescence signal (right picture). d. Explanation of the peritoneal carcinosis scoring. e. The histogram represent the mean of PCI score observed in each mouse of sacrifice. f. Tumors were snap-frozen after isolation and then were sectioned to 10 μm for immuno-staining. Slides were stained with Anti Human IL6-R and IL-6 antibodies and Immunofluorescence images were acquired in confocal microscopy. Scale: 100 μm. g-h. RNA was extracted from isolated tumor of each group. The relative quantification of IL-6 (g) and IL-6R (h) gene was performed by RT-PCR. The histogram represents ratios between each condition groups and the control group of their 2–ΔΔCp real-time PCR values. p < 0.05 (*), p < 0.01 (**) or p < 0.001 (***)
Fig. 4
Fig. 4
a. Real-time qPCR were performed on OCCs trans, OCCs trans + blocking antibody against IL-6 (20 μg/mL) and the MSC after the chemotherapy treatment (100 μM carboplatin, 0.1 μM Taxol). Relative transcript levels are represented as the ratios between the populations of interest and the control (OCCs alone with chemotherapy) of their 2–ΔΔCp real-time PCR values. b. OCCs were incubated or not with MSC in presence or not of a blocking antibody against IL-6 (20 μg/mL) for 48 h. Elisa assay for IL-6 was performed on the supernatant of the cells. Histograms represent the mean (±SEM) for triplicates. c. OCCs were incubated or not with MSC in presence or not of a blocking antibody against IL-6 (20 μg/mL) for 48 h. The supernatants were removed and replace with a fresh one. After 6 h the supernatants were harvested and an Elisa assay for IL-6 was performed on the supernatant of the cells. Histograms represent the mean (±SEM) for triplicates. d. The relative quantification of IL-6 gene was performed by RT-PCR on APOCC and Ovcar3 after treatment with ShRNA for IL-6 or the ShRNA scramble (ScR). The histogram represents ratios between the APOCC SH-IL6 and APOCC ScR of their 2–ΔΔCp real-time PCR values. e. Ovcar3-Scr (Scr) and Ovcar3 SH-IL6 (SH) alone (Ø) or in transwell with MSC (Trans) were treated with Carboplatin (100 μM) and Taxol (0.1 μM) for 24 h. Cells were harvested and counted. Histograms represent the percentage of living cells compared to the untreated cells. The results are presented as the mean (±SEM) of 3 different experiments. f. APOCC-Scr and APOCC SH-IL6 alone or in transwell with MSC (Trans) were treated with Carboplatin (100 μM) and Taxol (0.1 μM) for 24 h. Cells were harvested and stained with PI and Annexin V. The percentage of live cells (Annexin V/PI, green gate), apoptotic cells (Annexin V+, PI, red gate) and dead cells (Annexin V+/PI+, black gate) are represented for each conditions on the plot. p < 0.05 (*), p < 0.01 (**) or p < 0.001 (***)
Fig. 5
Fig. 5
a. Real-time qPCR were performed on MSC before or after the experiment described in Fig. 1d. Relative transcript levels are represented as the log10 of ratios between the MSC after and before experiment of their 2–ΔΔCp real-time PCR values. b. OCCs (APOCC, Ovcar3 or Skov3) were treated or not with MCP-1 (10 nM), CCL5 (100 ng/ml), CXCL12 (100 ng/ml), bFGF (10 ng/ml) for 48 h prior treatment with Carboplatin (100 μM) and Taxol (0.1 μM) for 24 h. Histograms represent the percentage of living cells compared to the untreated cells. The results are presented as the mean (±SEM) of 3 different experiments. c. Western blot for IL-6 was performed on OCCs (APOCC, A; Ovcar3, O; or Skov3, S) treated or not with MCP-1 (10 nM) and CCL5 (100 ng/ml) for 48 h. d. Ovcar3, APOCC and Skov3 were treated or not with MCP-1 (10 nM) and CCL5 (100 ng/ml) for 48 h. The supernatants were harvested and an Elisa assay for IL-6 was performed on the supernatant of the cells. Histograms represent the mean (±SEM) for triplicates. p < 0.05 (*), p < 0.01 (**) or p < 0.001 (***)
Fig. 6
Fig. 6
a. Proteins were extracted from isolated tumor of each group. Proteome profiler human phosphokinase array was performed. The table represents the fold increase of pixel density of each condition compared to control. b. Western blot for phospho-PYK2 and total-PYK2 was performed on OCCs (APOCC and APOCC SH-IL6) co-incubated or not with MSC for 48 h and treated or not with chemotherapy Carboplatin (100 μM) and Taxol (0.1 μM) for 24 h. c. Western blot for phospho-PYK2 and total-PYK2 was performed on OCCs (APOCC) co-incubated or not with MSC in presence or not of PF431396 (5 μM) for 48 h and treated or not with chemotherapy Carboplatin (100 μM) and Taxol (0.1 μM) for 24 h. d. The relative quantification of IL-6 (gene was performed by RT-PCR. The histogram represents ratios between each condition and the control group (no MSC, no chemotherapy) of their 2–ΔΔCp real-time PCR values. e. OCCs (Ovcar3, APOCC and Skov3) were co-incubated or not with MSC in presence or not of PF431396 (5 μM) for 48 h. Supernatants were harvested and an Elisa assay for IL-6 was performed on the supernatant of the cells. Histograms represent the mean (±SEM) for triplicates. f. Western blot for phospho-PYK2 and total PYK2 was performed on OCCs (Ovcar3, APOCC and Skov3) incubated with IL-6 (50 ng/ml) for 6 h. g. OCCs (Ovcar3, APOCC and Skov3) were treated with MCP-1 (10 nM), CCL5 (100 ng/ml), IL-6 (50 ng/ml) or co-incubated with MSC, in presence (light graph) or not (plain graph) of PF431396 (5 μM) for 48 h prior treatment with Carboplatin (100 μM) and Taxol (0.1 μM) for 24 h. Histograms represent the ratio of living cells compared to the not treated cells. p < 0.05 (*), p < 0.01 (**) or p < 0.001 (***)
Fig. 7
Fig. 7
Schematic representation of MSC role in OCC chemoresistance

References

    1. Siegel R, Naishadham D, Jemal A. Cancer statistics, 2012. CA Cancer J Clin. 2012;62:10–29. doi: 10.3322/caac.20138. - DOI - PubMed
    1. Mabuchi S, Kawase C, Altomare DA, Morishige K, Hayashi M, Sawada K, Ito K, Terai Y, Nishio Y, Klein-Szanto AJ, et al. Vascular endothelial growth factor is a promising therapeutic target for the treatment of clear cell carcinoma of the ovary. Mol Cancer Ther. 2010;9:2411–2422. doi: 10.1158/1535-7163.MCT-10-0169. - DOI - PMC - PubMed
    1. Burger RA. Overview of anti-angiogenic agents in development for ovarian cancer. Gynecol Oncol. 2011;121:230–238. doi: 10.1016/j.ygyno.2010.11.035. - DOI - PubMed
    1. Guerrouahen BS, Pasquier J, Kaoud NA, Maleki M, Beauchamp MC, Yasmeen A, Ghiabi P, Lis R, Vidal F, Saleh A, et al. Akt-activated endothelium constitutes the niche for residual disease and resistance to bevacizumab in ovarian cancer. Mol Cancer Ther. 2014;13:3123–3136. doi: 10.1158/1535-7163.MCT-13-1053. - DOI - PubMed
    1. Mirza MR, Monk BJ, Herrstedt J, Oza AM, Mahner S, Redondo A, Fabbro M, Ledermann JA, Lorusso D, Vergote I, et al. Niraparib maintenance therapy in platinum-sensitive, recurrent ovarian cancer. N Engl J Med. 2016;375:2154–2164. doi: 10.1056/NEJMoa1611310. - DOI - PubMed

Publication types

MeSH terms