. 2018 Mar 6;27(3):559-571.e5.
doi: 10.1016/j.cmet.2018.01.005. Epub 2018 Feb 15.

An Integrated Understanding of the Rapid Metabolic Benefits of a Carbohydrate-Restricted Diet on Hepatic Steatosis in Humans

Affiliations

An Integrated Understanding of the Rapid Metabolic Benefits of a Carbohydrate-Restricted Diet on Hepatic Steatosis in Humans

Adil Mardinoglu et al. Cell Metab. .

Abstract

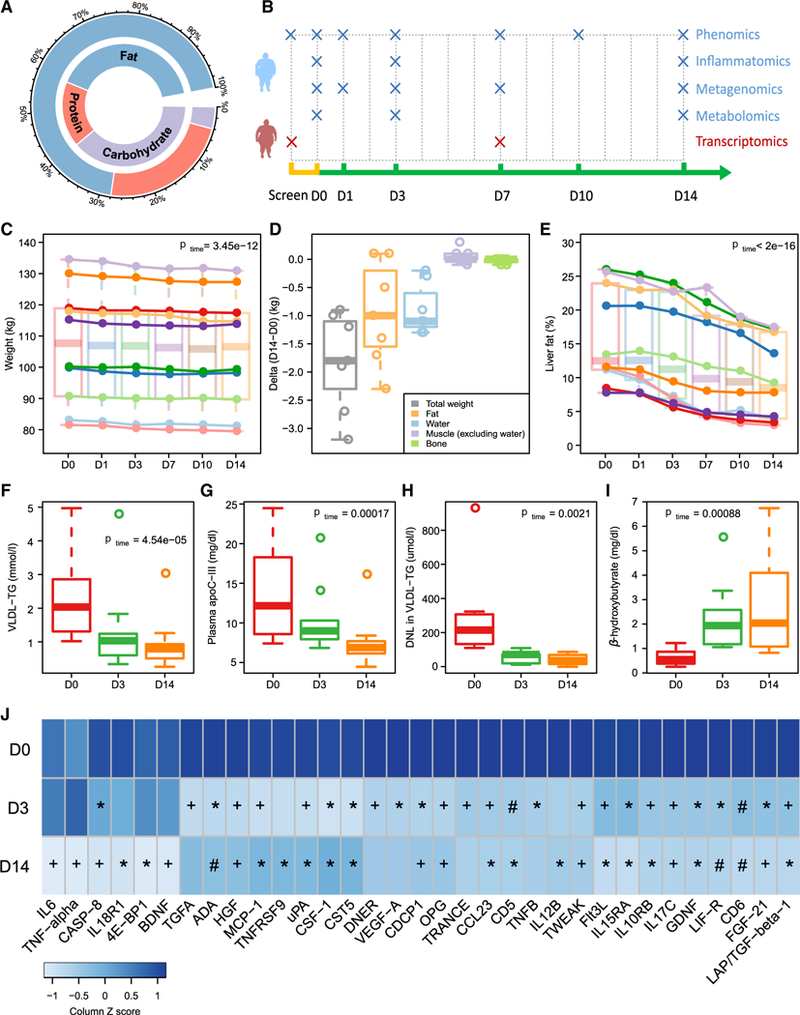
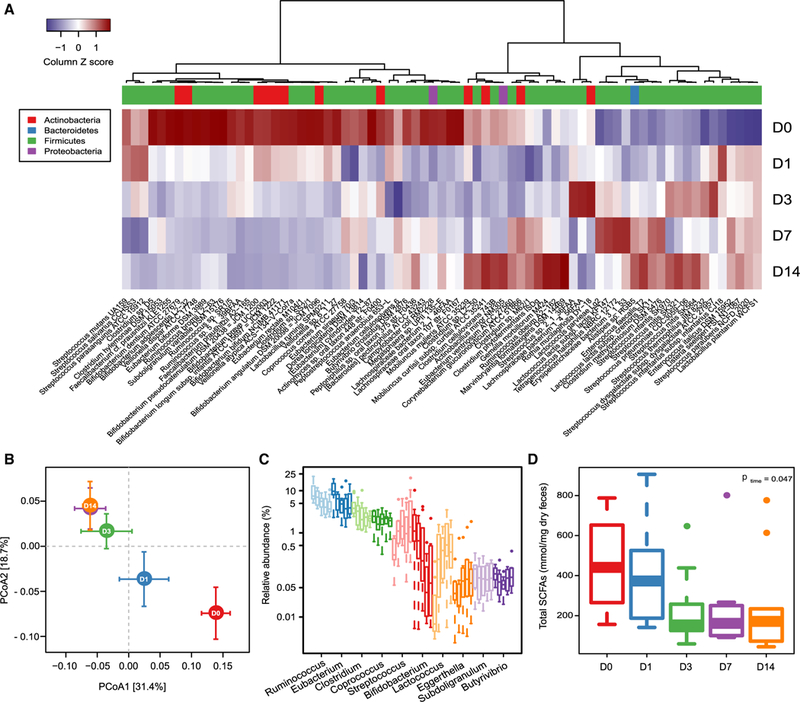
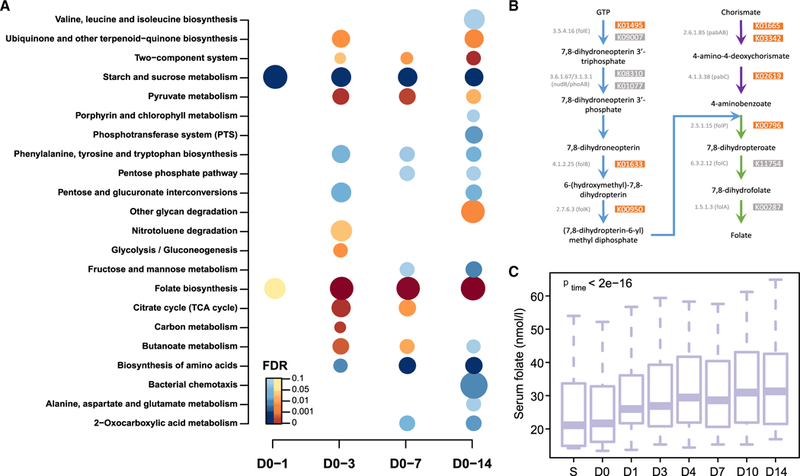
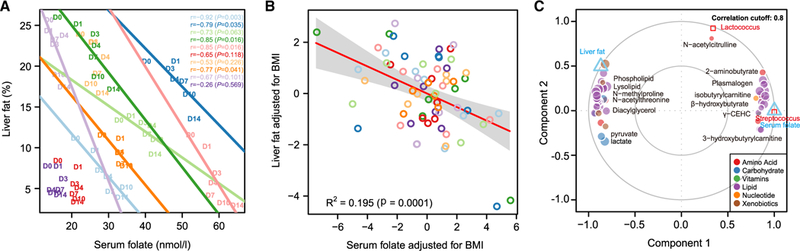
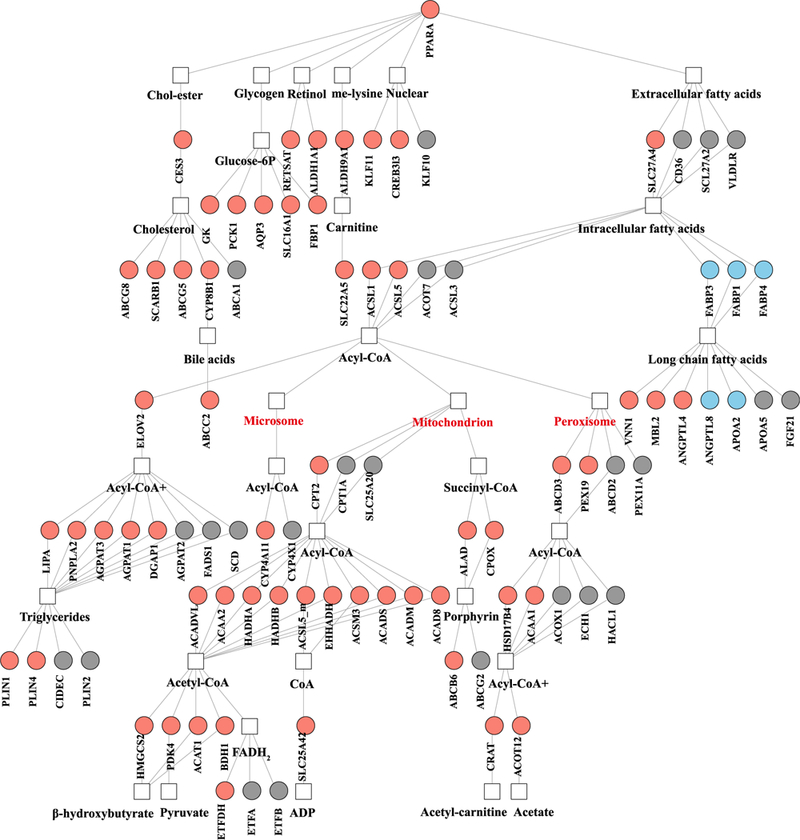
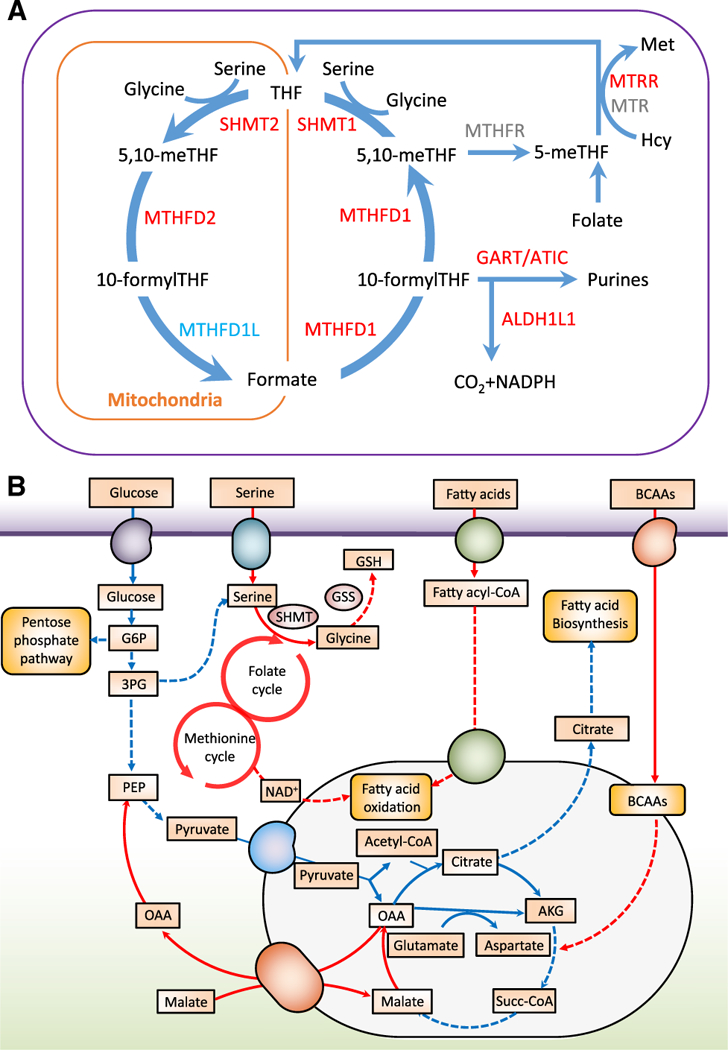
A carbohydrate-restricted diet is a widely recommended intervention for non-alcoholic fatty liver disease (NAFLD), but a systematic perspective on the multiple benefits of this diet is lacking. Here, we performed a short-term intervention with an isocaloric low-carbohydrate diet with increased protein content in obese subjects with NAFLD and characterized the resulting alterations in metabolism and the gut microbiota using a multi-omics approach. We observed rapid and dramatic reductions of liver fat and other cardiometabolic risk factors paralleled by (1) marked decreases in hepatic de novo lipogenesis; (2) large increases in serum β-hydroxybutyrate concentrations, reflecting increased mitochondrial β-oxidation; and (3) rapid increases in folate-producing Streptococcus and serum folate concentrations. Liver transcriptomic analysis on biopsy samples from a second cohort revealed downregulation of the fatty acid synthesis pathway and upregulation of folate-mediated one-carbon metabolism and fatty acid oxidation pathways. Our results highlight the potential of exploring diet-microbiota interactions for treating NAFLD.

Trial registration: ClinicalTrials.gov NCT02558530.

Keywords: FGF21; NAFLD; PPAR-α; Streptococcus; carbohydrate-restricted diet; folate; inflammation; microbiome; multi-omics; β-oxidation.


Figures

Figure 1.
Figure 1.. Reduced Carbohydrate Consumption Improves Liver Lipid Metabolism and Reduces Inflammation in Obese Subjects with NAFLD
(A) Percentage of energy from carbohydrate, protein, and fat at baseline (inner circle) and during the 14-day dietary intervention (outer circle). (B) Study design indicating time points used in the multi-omics analysis. D, day. (C–E) Boxplots (with median) and individual data showing (C) weight changes across the study period, (D) changes in body composition between day 0 and day 14, and (E) liver fat changes across the study period. (F–I) Boxplots (with median) showing (F) plasma concentrations of VLDL-triglycerides (TG) (n = 10), (G) plasma concentrations of apoC-III (n = 10), (H) DNL(n = 9), and (I) plasma concentrations of β-hydroxybutyrate (n = 10) at days 0, 3, and 14. (J) Heatmap showing statistically significant reductions in inflammatory markers and FGF-21 over the study period (FDR < 0.05; n = 10). Post hoc group comparisons (D0 versus D3 and D0 versus D14) were performed by paired t test with Bonferroni correction. *p < 0.05; +p < 0.01; #p < 0.001. p or FDR values across time were obtained by one-way ANOVA with repeated measurements. See also Figures S1 and S2 and Table S1.
Figure 2.
Figure 2.. Reduced Carbohydrate Consumption Rapidly Alters Gut Microbial Composition
(A) Heatmap showing significant changes in the abundance of bacterial strains over the 14-day study period. D, day. FDR < 0.05; likelihood ratio test. (B) PCoA plot based on the relative abundance of all bacterial strains that are significantly altered over the study period at the indicated time points (mean ± SEM; p D1 versus D0 = 0.049; Adonis test based on 5,000 permutations). (C) Boxplots (with median) showing the relative abundance of the ten most abundant genera that were significantly altered by the diet over the study period (n = 10). FDR < 0.05; likelihood ratio test. (D) Boxplots (with median) showing fecal concentrations of SCFAs at days 0,1,3,7, and 14(n = 10).p values across time were obtained by one-way ANOVA with repeated measurements. See also Table S2.
Figure 3.
Figure 3.. Reduced Carbohydrate Consumption Promotes Microbial Shifts toward Folate Production
(A) KEGG pathway analysis showing pathways that were significantly altered at the indicated times over the 14-day study period (n = 10). D, day. Pathways that are reduced or increased are shown in blue and brown, respectively. FDR < 0.1; hypergeometric test. The size of the bubble is proportional to the enrichment score for each KEGG pathway term. (B) Bacterial folate biosynthesis pathway showing KOs that significantly increased over the study period (brown boxes). (C) Boxplots (with median) showing changes in serum concentrations of folate changes over the study period (n = 10). p values across time were obtained by one-way ANOVA with repeated measurements. S, screen. See also Figures S3 and S4 and Table S2.
Figure 4.
Figure 4.. Serum Folate Is Associated with Improved Liver Lipid Metabolism
(A) Pearson correlations between liver fat and serum folate in each individual in the first cohort. D, day. (B) Linear mixed-effect model (with 95% confidence bands highlighted) between liver fat and serum folate after adjusting for contributions from BMI to both variables; samples from the same individual are colored as in (A) (n = 10). (C) Integration of liver fat, folate-producing bacteria, serum folate, and metabolomics data from the first cohort (n = 10) using a multivariate method (mixDIABLO with repeated measurements) with a correlation cutoff of 0.8. Components are linear combinations of variables from each omics dataset that are maximally correlated using a full-design matrix. See also Figures S5 and S6 and Table S3.
Figure 5.
Figure 5.. Liver Transcriptome Changes Reflect Improved Hepatic Lipid Metabolism
Gene regulatory network for PPARα showing significant increases (salmon) and decreases (light blue) in genes in liver from individuals in the second cohort after 7 days on a low-carbohydrate diet with increased protein content (n = 7). FDR < 0.1; Wald test with paired design. See also Table S5.
Figure 6.
Figure 6.. Integration of Liver Transcriptomics and Plasma Metabolomics Data
(A) Reactions involved in folate-mediated one-carbon metabolism showing significant increases (red) and decreases (light blue) in genes in liver from individuals after 7 days on a low-carbohydrate diet with increased protein content (n = 7). FDR < 0.1; Wald test with paired design. (B) A genome-wide metabolic model for the liver integrating both serum metabolomics data and liver transcriptomics data. Red lines indicate increased fluxes, and blue lines indicate decreased fluxes. See also Tables S5 and S6.

Similar articles

Cited by

References

    1. Akesson B, Fehling C, Jagerstad M, and Stenram U (1982). Effect of experimental folate deficiency on lipid metabolism in liver and brain. Br. J. Nutr. 47, 505–520. - PubMed
    1. Anders S, and Huber W (2010). Differential expression analysis for sequence count data. Genome Biol. 11, R106. - PMC - PubMed
    1. Asrih M, and Jornayvaz FR (2013). Inflammation as a potential link between nonalcoholic fatty liver disease and insulin resistance. J. Endocrinol. 218, R25–R36. - PubMed
    1. Astrup A, Meinert Larsen T, and Harper A (2004). Atkins and other low-carbohydrate diets: hoax or an effective tool for weight loss? Lancet 364, 897–899. - PubMed
    1. Aufreiter S, Gregory JF 3rd, Pfeiffer CM, Fazili Z, Kim YI, Marcon N, Kamalaporn P, Pencharz PB, and O’Connor DL (2009). Folate is absorbed across the colon of adults: evidence from cecal infusion of (13)C-labeled [6S]-5-formyltetrahydrofolic acid. Am. J. Clin. Nutr. 90, 116–123. - PMC - PubMed

Publication types

Associated data