. 2018 Mar 26;44(6):665-678.e6.
doi: 10.1016/j.devcel.2018.01.018. Epub 2018 Feb 15.

Pericyte ALK5/TIMP3 Axis Contributes to Endothelial Morphogenesis in the Developing Brain

Affiliations

Pericyte ALK5/TIMP3 Axis Contributes to Endothelial Morphogenesis in the Developing Brain

Jui M Dave et al. Dev Cell. .

Erratum in

Abstract

The murine embryonic blood-brain barrier (BBB) consists of endothelial cells (ECs), pericytes (PCs), and basement membrane. Although PCs are critical for inducing vascular stability, signaling pathways in PCs that regulate EC morphogenesis during BBB development remain unexplored. Herein, we find that murine embryos lacking the transforming growth factor β (TGF-β) receptor activin receptor-like kinase 5 (Alk5) in brain PCs (mutants) develop gross germinal matrix hemorrhage-intraventricular hemorrhage (GMH-IVH). The germinal matrix (GM) is a highly vascularized structure rich in neuronal and glial precursors. We show that GM microvessels of mutants display abnormal dilation, reduced PC coverage, EC hyperproliferation, reduced basement membrane collagen, and enhanced perivascular matrix metalloproteinase activity. Furthermore, ALK5-depleted PCs downregulate tissue inhibitor of matrix metalloproteinase 3 (TIMP3), and TIMP3 administration to mutants improves endothelial morphogenesis and attenuates GMH-IVH. Overall, our findings reveal a key role for PC ALK5 in regulating brain endothelial morphogenesis and a substantial therapeutic potential for TIMP3 during GMH-IVH.

Keywords: ALK5; TIMP3; blood vessel; blood-brain barrier; endothelial cells; germinal matrix hemorrhage; intracranial hemorrhage; pericytes; vascular development.


Conflict of interest statement

Competing interests: The authors declare no competing interests.

Figures

Figure 1
Figure 1. Brain hemorrhage of Pdgfrb-Cre, Alk5(flox/flox) mutant embryonic mice
(A, B, D and E) Mutant and Pdgfrb-Cre, Alk5(flox/+) control embryos are shown at E11.5–13.5 as indicated. In (A), whole mount views of embryos demonstrate gross ICH initially visible at E12.5 (black arrows). In (B) Hemorrhage area is quantified as the ratio of hemorrhage area (white dotted-line) to head area (red dotted-line). In (D and E), H&E stained coronal brain sections demonstrate GMH (yellow asterisks) and IVH (white +’s) in mutants. Boxed regions are shown as close-ups on the right. L and M, lateral and medial ganglionic eminences; LV, lateral ventricle. Scale bars, 1 mm (A, B) and 200 μm (D, E). (C) Quantification of gross hemorrhage area in mutants at E11.5–13.5, calculated as described in (B). Each symbol represents an individual embryo. Bars indicate averages ± SD. One way ANOVA with Tukey’s post hoc test, ***p<0.001, ****p<0.0001. See also Figures S1 and S2.
Figure 2
Figure 2. Abnormal EC and PC phenotype in GM of Pdgfrb-Cre, Alk5(flox/flox) mutants
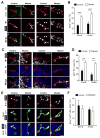
(A and B) GM sections of mutant and Pdgfrb-Cre, Alk5(flox/+) control embryos at E11.5 (A) and E13.5 (B) stained for CDH5 (ECs) and NG2 (PCs). Boxed regions are shown as close-ups in columns on the right. Arrowheads indicate areas of mutant EC vessels lacking PC coverage. Scale bars, 25 μm. (C and D) Quantification of PC coverage of EC vessels (at indicated ages) and of EC vessel area, diameter and lumen area at E13.5. At least 150 blood vessels were scored per mouse (n=3 mice for each condition). Data are averages ± SD. Student’s t test, **p<0.01, ***p<0.001, ****p<0.0001. See also Figures S3 and S4.
Figure 3
Figure 3. EC hyperproliferation in Pdgfrb-Cre, Alk5(flox/flox) mutant embryos
(A, C and E) GM sections of mutant and Pdgfrb-Cre, Alk5(flox/+) control embryos in (A and C) also bearing ROSAR26(mTmG/+) in (E) at E11.5 and E13.5 were stained for: ERG (EC nuclei), isolectin B4 (IB4, EC) and BrdU in (A); Ki67 (proliferation marker), IB4 and propidium iodide (PI, nuclei) in (C); and ERG, GFP (Cre-reporter), BrdU and DAPI in (E). BrdU was injected in pregnant dams 6 hours prior to dissection in (A and E). Yellow arrowheads indicate proliferative ECs as marked by BrdU+ ERG+ nuclei of IB4+ cells in (A) and Ki67+ nuclei within IB4+ vessels in (C). Yellow arrows indicate proliferative PCs as marked by BrdU+ DAPI+ and ERG– nuclei in GFP+ cells in (E). Scale bars, 25 μm. (B, D and F) Histograms representing the percentage of ECs or PCs that are proliferative in the GM vessels for control and mutant embryos at E11.5 and E13.5. Quantification of the percentage of EC nuclei that are BrdU+ in (B) or Ki67+ in (D) and PC nuclei that are BrdU+ in (F). At least 150 blood vessels were scored per mouse (n=3 mice for each condition and age). Data are averages ± SD. Two-way ANOVA with Sidak’s multiple comparison test, **p<0.01, ***p<0.001, versus control.
Figure 4
Figure 4. Effects of human PC-ALK5 silencing on EC migration, proliferation and endothelial capillary network formation
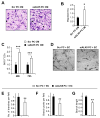
(A) ECs were cultured in conditioned media (CM) collected from PCs pretreated with scrambled (Scr) or ALK5-specific siRNA (siALK5) for 48 hours. Pretreated ECs were placed in a Boyden apparatus top chamber to assess migration towards VEGF-A (100 ng/ml) for 10 hours, and migrated cells (i.e., on the membrane’s bottom surface) were stained with Crystal Violet. (B) Quantification of migrated ECs per field from images as shown in (A) (n=3 experiments, 6 fields per experiment). (C) ECs were cultured in CM collected from PCs pretreated with scrambled (Scr) or ALK5-specific siRNA (siALK5) for 48 hours or 72 hours. BrdU was added 6 hours prior to fixing ECs and percent of BrdU+ ECs were quantified (n=3 experiments, 9 fields per experiment). (D) PCs pretreated with Scr siRNA or siALK5 were co-cultured with ECs on Matrigel for 6 hours, and Brightfield images are shown. (E to G) Histograms generated from images as in (D) show EC branches (E), branch points (F) and branch length (G) for siALK5 PC + EC co-culture normalized to Scr PC + EC control (n=3 experiments, 6 fields per experiment). Scale bars, 100 μm. Data are averages ± SD. Student’s t test, *p<0.05, **p<0.01, ***p<0.001. See also Figure S5.
Figure 5
Figure 5. Abnormal basement membrane and enhanced MMP activity in Pdgfrb-Cre, Alk5(flox/flox) mutants
(A, B, F and G) GM sections of Pdgfrb-Cre, Alk5(flox/+) control and mutant embryos also carrying ROSA26R(mTmG/+) at E13.5 stained for GFP (PCs) and either collagen type IV (Col-IV) (A), collagen type I (Col-I) (B), MMP9 (F) or MMP2 (G). In mutants, white arrowheads indicate GFP+ PC sleeves lacking basement membrane Col-IV (A) and Col-I (B), and arrows indicate up-regulated perivascular MMP9 (F) and MMP2 (G) levels in mutants. (C) Quantification of Col-IV and Col-I coverage of GFP+ PC sleeves at E13.5 from images in (A and B). (H) Quantification of MMP2 and MMP9 staining intensity around GFP+ PC sleeves at E13.5 from images in (F and G). In (C and H), at least 100 blood vessels were scored per mouse (n=3 mice for each condition). Data are averages ± SD. Two-way ANOVA with Sidak’s multiple comparison test, *p<0.05, **p<0.01. (D and E) In situ zymography with fluorescein-conjugated DQ-gelatin substrate and staining for IB4 of GM cryosections from mutant and control embryos at E13.5. Yellow arrowheads indicate gelatinolytic activity around IB4+ vessels in mutants. Treatment of cryosections with a MMP inhibitor (BB94 or rTIMP3) in (E) attenuates the enhanced gelatinolytic activity of mutants. Scale bars, 25 μm. See also Figures S4 and S5.
Figure 6
Figure 6. TGFβ pathway regulates PC TIMP3 levels, and rTIMP3 mitigates effects of ALK5-silenced PCs on EC network
(A) ALK5 and TIMP3 mRNA levels as assessed by qRT-PCR relative to GAPDH in Scr- and siALK5-treated human PCs and normalized to Scr levels (n=3). Student’s t test, ***p<0.001, ****p<0.0001, versus Scr. (B) PCs were treated with TGFβ1 for indicated times and RNA was isolated. Histogram shows TIMP3 mRNA levels relative to 18S rRNA as assessed by qRT-PCR and normalized to 0 hour (n=3). One-way ANOVA, *p<0.05 versus 0 hour. (C) Western blot of TIMP3 and GAPDH from co-cultures of PCs pretreated with Scr or siAlk5 and ECs (n=3). (D) Zs+ NG2+ CD31 cells (PCs) were isolated by FACS from the brains of E13.5 Pdgfrb-Cre, ROSA26R(Zs/+) embryos also carrying either Alk5(flox/+) (control) or Alk5(flox/flox) (mutant) as described in Figure S5. RNA levels of Alk5 and Timp3 relative to 18S rRNA were measured by qRT-PCR and normalized to control (n=3). Student’s t test, **p<0.01, ***p<0.001, versus control. (E) ECs co-cultured with Scr or siALK5 pretreated PCs on Matrigel in the presence of vehicle or rTIMP3. Representative Brightfield images are shown. Scale bar, 100 μm. (F to H) Histograms showing EC branches (F), branch points (G) and branch length (H) for rTIMP3- or vehicle-treated co-culture of ECs and Scr or siALK5-pretreated PCs normalized to vehicle-treated Scr PC + EC control (n=3 experiments, 6 fields per condition for each experiment). One-way ANOVA with Tukey’s post hoc test, **p<0.01, ***p<0.001. All data are averages ± SD. See also Figures S5–S7.
Figure 7
Figure 7. rTIMP3 attenuates GMH in Pdgfrb-Cre, Alk5(flox/flox) mutant embryonic mice
Pregnant dams were injected daily from E10.5–12.5 with either vehicle (PBS) or rTIMP, and mutant embryos were harvested at E13.5. (A) Brightfield images of whole mutant embryos are shown with black arrows indicating hemorrhage. (B) Quantification of gross hemorrhage with each symbol representing an individual embryonic mouse at E13.5. Data are averages ± SD. Student’s t-test, ***p<0.001. (C) H&E stained coronal brain sections. GMH and IVH are denoted by yellow asterisks and white +’s, respectively. (D) GM coronal sections stained for CDH5 (EC) and NG2 (PC). Boxed regions are shown in the right columns as close-ups with white arrowheads indicating areas on EC vessels lacking PC coverage. (E and F) Histograms of PC coverage of EC vessels normalized to vehicle controls and EC vessel area, diameter and lumen area in controls or mutants treated with vehicle (PBS) or rTIMP3. At least 150 blood vessels were scored per mouse (n=3 mice for each condition). Data are averages ± SD. One way ANOVA with Tukey’s multiple comparision test, ****p<0.0001, **p<0.01 as compared to mutant with rTIMP3, #p<0.0001 as compared to control with vehicle. (G) GM sections stained for Ki67 (proliferation marker), IB4, and propidium iodide (PI, nuclei). Arrowheads indicate Ki67+ nuclei within IB4+ vessels. (H) Percentage of EC nuclei that are Ki67+ per treatment group. At least 200 blood vessels were scored per mouse (n=3 mice for each condition). Data are averages ± SD. Student’s t-test, *p<0.05. Scale bars, 1 mm (A), 200 μm (C) and 25 μm (D, G). See also Figure S7.

References

    1. Armulik A, Genove G, Betsholtz C. Pericytes: developmental, physiological, and pathological perspectives, problems, and promises. Dev Cell. 2011;21(2):193–215. - PubMed
    1. Armulik A, Genove G, Mae M, Nisancioglu MH, Wallgard E, Niaudet C, He L, Norlin J, Lindblom P, Strittmatter K, Johansson BR, Betsholtz C. Pericytes regulate the blood-brain barrier. Nature. 2010;468(7323):557–61. - PubMed
    1. Arnold TD, Niaudet C, Pang MF, Siegenthaler J, Gaengel K, Jung B, Ferrero GM, Mukouyama YS, Fuxe J, Akhurst R, Betsholtz C, Sheppard D, Reichardt LF. Excessive vascular sprouting underlies cerebral hemorrhage in mice lacking alphaVbeta8-TGFbeta signaling in the brain. Development. 2014;141(23):4489–99. - PMC - PubMed
    1. Ballabh P. Intraventricular hemorrhage in premature infants: mechanism of disease. Pediatr Res. 2010;67(1):1–8. - PMC - PubMed
    1. Ballabh P, Xu H, Hu F, Braun A, Smith K, Rivera A, Lou N, Ungvari Z, Goldman SA, Csiszar A, Nedergaard M. Angiogenic inhibition reduces germinal matrix hemorrhage. Nat Med. 2007;13(4):477–85. - PubMed

Publication types

MeSH terms

Substances