

Limited Access to a High Fat Diet Alters Endocannabinoid Tone in Female Rats
- PMID: 29456490
- PMCID: PMC5801427
- DOI: 10.3389/fnins.2018.00040
Limited Access to a High Fat Diet Alters Endocannabinoid Tone in Female Rats
Abstract
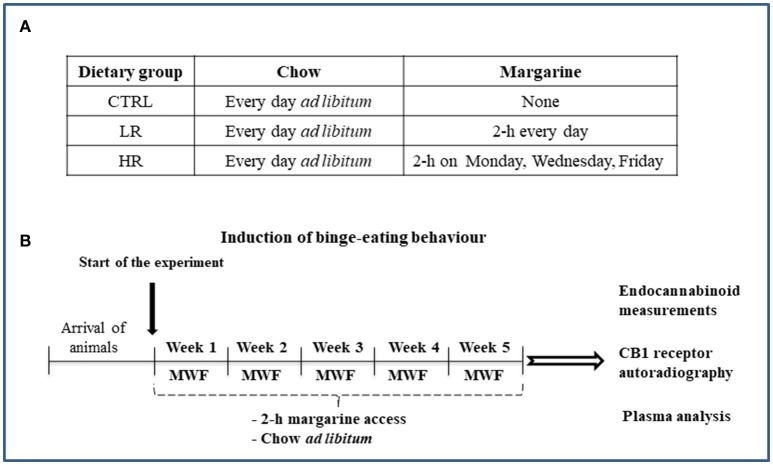
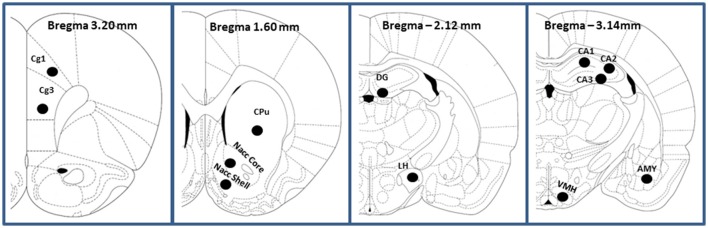
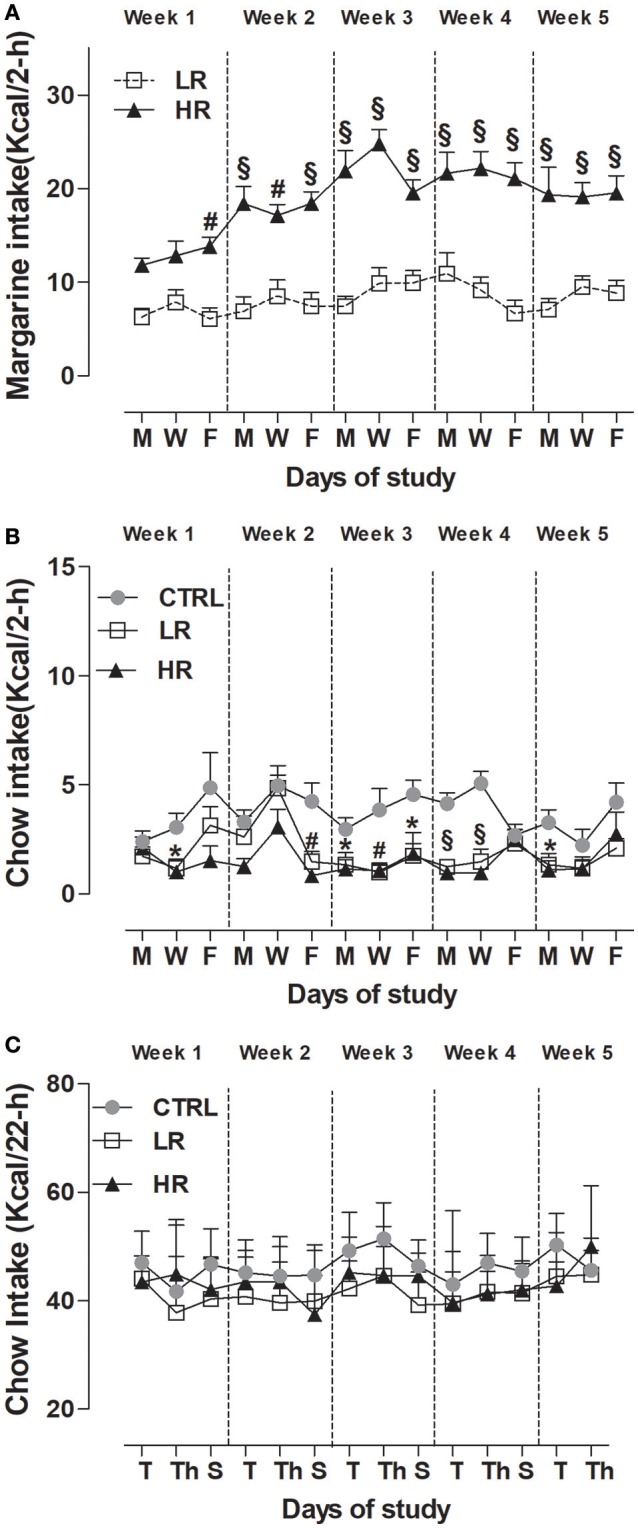
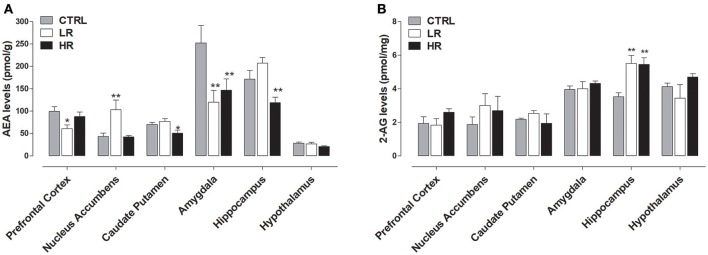
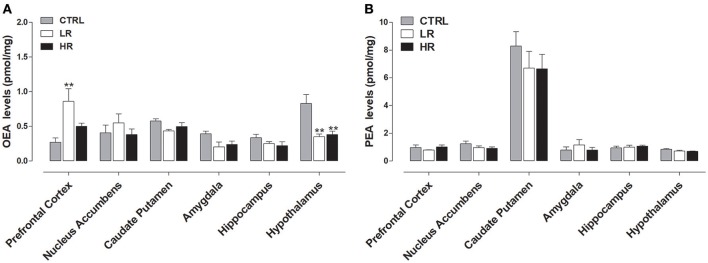
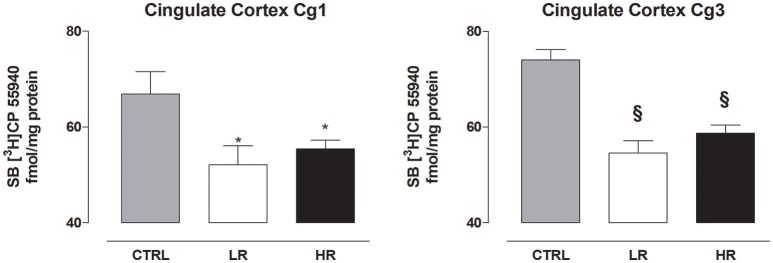
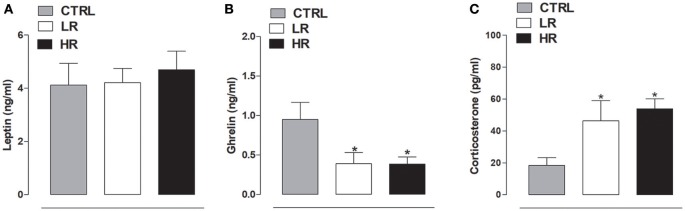
Emerging evidence suggest an impaired endocannabinoid activity in the pathophysiology of binge eating disorder (BED). Herein, we investigated whether endocannabinoid tone could be modified as a consequence of dietary-induced binge eating in female rats. For this purpose, brain levels of the endocannabinoids anandamide (AEA) and 2-arachidonoyl glycerol (2-AG), as well as two endocannabinoid-like lipids, oleoylethanolamide (OEA) and palmitoylethanolamide (PEA), were assessed in different brain areas involved in the hedonic feeding (i.e., prefrontal cortex, nucleus accumbens, amygdala, hippocampus, and hypothalamus). The brain density of cannabinoid type-1 receptors (CB1) was also evaluated. Furthermore, we determined plasma levels of leptin, ghrelin, and corticosterone hormones, which are well-known to control the levels of endocannabioids and/or CB1 receptors in the brain. To induce binge eating behavior, rats were subject to an intermittent and limited access to a high fat diet (HFD) (margarine). Three experimental groups were used, all with ad libitum access to chow: control (CTRL), with no access to margarine; low restriction (LR), with 2 h margarine access 7 days/week; high restriction (HR), with 2 h margarine access 3 days/week. Bingeing was established when margarine intake in the HR group exceeded that of the LR group. Our results show that, compared to CTRL, AEA significantly decreased in the caudate putamen, amygdala, and hippocampus of HR group. In contrast, 2-AG significantly increased in the hippocampus while OEA decreased in the hypothalamus. Similar to the HR group, AEA and OEA decreased respectively in the amygdala and hypothalamus and 2-AG increased in the hippocampus of LR group. Moreover, LR group also had AEA decreased in the prefrontal cortex and increased in the nucleus accumbens. In both groups we found the same reduction of CB1 receptor density in the prefrontal cortex compared to CTRL. Also, LR and HR groups showed alterations in both ghrelin and corticosterone levels, while leptin remained unaltered. In conclusion, our findings show a modified endocannabinoid tone due to margarine exposure, in several brain areas that are known to influence the hedonic aspect of food. Even if not uniquely specific to binge eating, margarine-induced changes in endocannabinoid tone could contributes to the development and maintenance of this behavior.
Keywords: 2-arachidonoyl glycerol; anandamide; binge eating disorder; cannabinoid type-1 receptors; high fat diet.
Figures
Similar articles
-
Pharmacological modulation of the endocannabinoid signalling alters binge-type eating behaviour in female rats.Br J Pharmacol. 2013 Jun;169(4):820-33. doi: 10.1111/bph.12014. Br J Pharmacol. 2013. PMID: 23072421 Free PMC article.
-
A moderate diet restriction during pregnancy alters the levels of endocannabinoids and endocannabinoid-related lipids in the hypothalamus, hippocampus and olfactory bulb of rat offspring in a sex-specific manner.PLoS One. 2017 Mar 27;12(3):e0174307. doi: 10.1371/journal.pone.0174307. eCollection 2017. PLoS One. 2017. PMID: 28346523 Free PMC article.
-
Impaired brain endocannabinoid tone in the activity-based model of anorexia nervosa.Int J Eat Disord. 2019 Nov;52(11):1251-1262. doi: 10.1002/eat.23157. Epub 2019 Aug 27. Int J Eat Disord. 2019. PMID: 31456239
-
Hedonic Eating and the "Delicious Circle": From Lipid-Derived Mediators to Brain Dopamine and Back.Front Neurosci. 2018 Apr 24;12:271. doi: 10.3389/fnins.2018.00271. eCollection 2018. Front Neurosci. 2018. PMID: 29740277 Free PMC article. Review.
-
Role of acylethanolamides in the gastrointestinal tract with special reference to food intake and energy balance.Best Pract Res Clin Endocrinol Metab. 2009 Feb;23(1):33-49. doi: 10.1016/j.beem.2008.10.003. Best Pract Res Clin Endocrinol Metab. 2009. PMID: 19285259 Review.
Cited by
-
Molecular Alterations of the Endocannabinoid System in Psychiatric Disorders.Int J Mol Sci. 2022 Apr 26;23(9):4764. doi: 10.3390/ijms23094764. Int J Mol Sci. 2022. PMID: 35563156 Free PMC article. Review.
-
On the Role of Central Type-1 Cannabinoid Receptor Gene Regulation in Food Intake and Eating Behaviors.Int J Mol Sci. 2021 Jan 1;22(1):398. doi: 10.3390/ijms22010398. Int J Mol Sci. 2021. PMID: 33401515 Free PMC article. Review.
-
Endocannabinoid System Regulation in Female Rats with Recurrent Episodes of Binge Eating.Int J Mol Sci. 2022 Dec 3;23(23):15228. doi: 10.3390/ijms232315228. Int J Mol Sci. 2022. PMID: 36499556 Free PMC article.
-
Hypothalamic cannabinoid signaling: Consequences for eating behavior.Pharmacol Res Perspect. 2024 Oct;12(5):e1251. doi: 10.1002/prp2.1251. Pharmacol Res Perspect. 2024. PMID: 39155548 Free PMC article. Review.
-
From Nutritional Patterns to Behavior: High-Fat Diet Influences on Inhibitory Control, Brain Gene Expression, and Metabolomics in Rats.ACS Chem Neurosci. 2024 Dec 18;15(24):4369-4382. doi: 10.1021/acschemneuro.4c00297. Epub 2024 Nov 28. ACS Chem Neurosci. 2024. PMID: 39607956 Free PMC article.
References
-
- American Psychiatric Association (APA) (2013). Diagnostic and Statistical Manual, 5th Edn. Washington, DC: American Psychiatric Association.
LinkOut - more resources
Full Text Sources
Other Literature Sources