. 2018 Feb 2:12:1.
doi: 10.3389/fnint.2018.00001. eCollection 2018.

The Influence of Feedback on Task-Switching Performance: A Drift Diffusion Modeling Account

Affiliations

The Influence of Feedback on Task-Switching Performance: A Drift Diffusion Modeling Account

Russell Cohen Hoffing et al. Front Integr Neurosci. .

Abstract

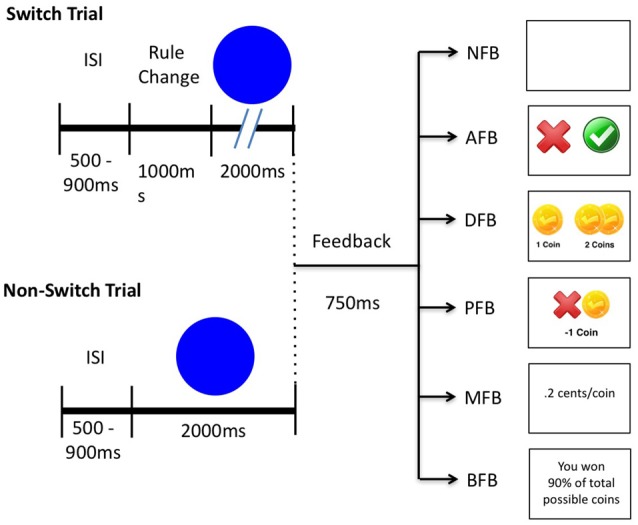
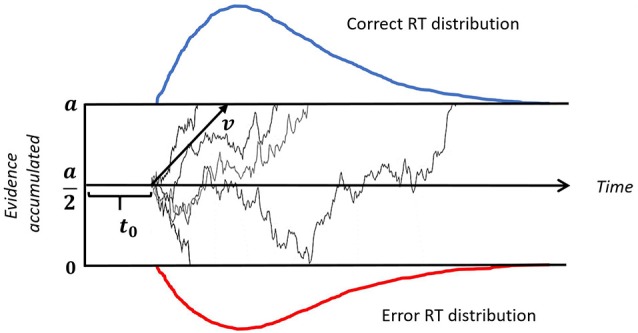
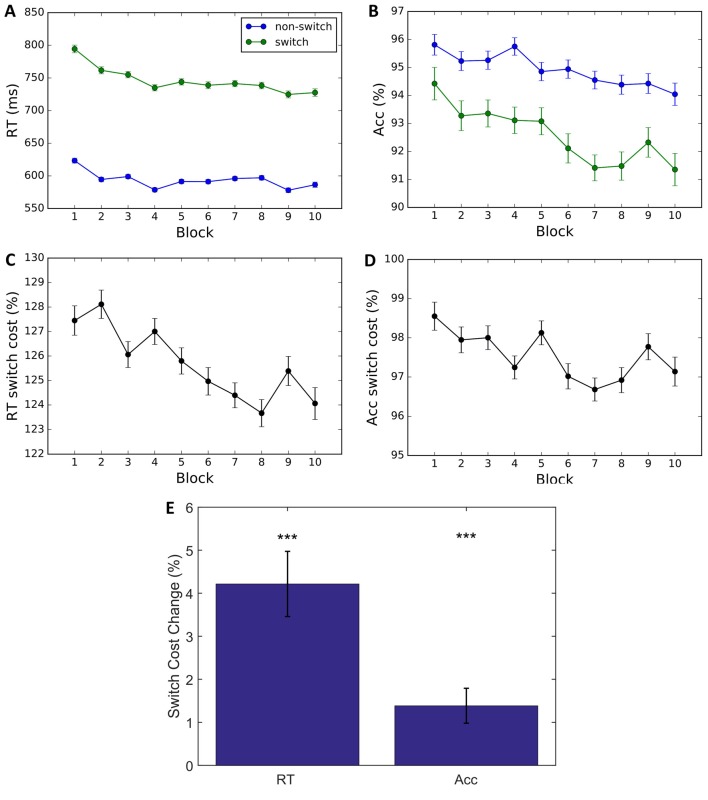
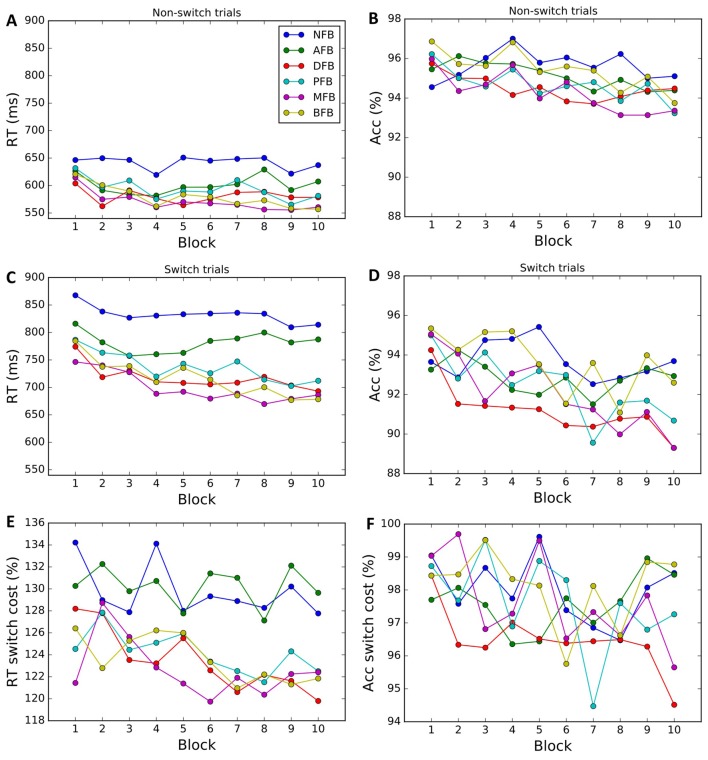
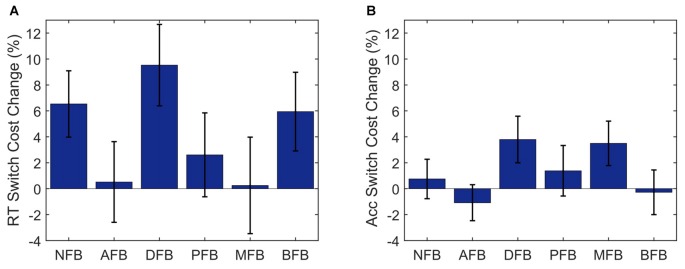
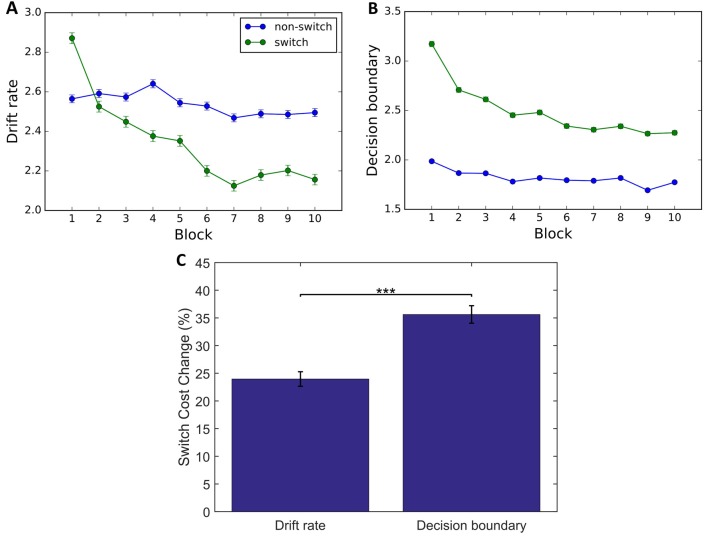
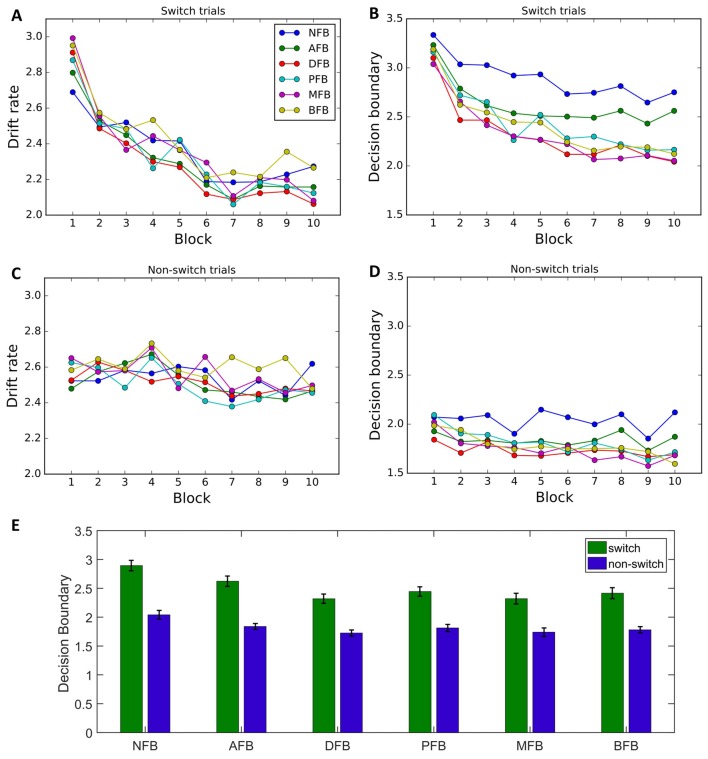
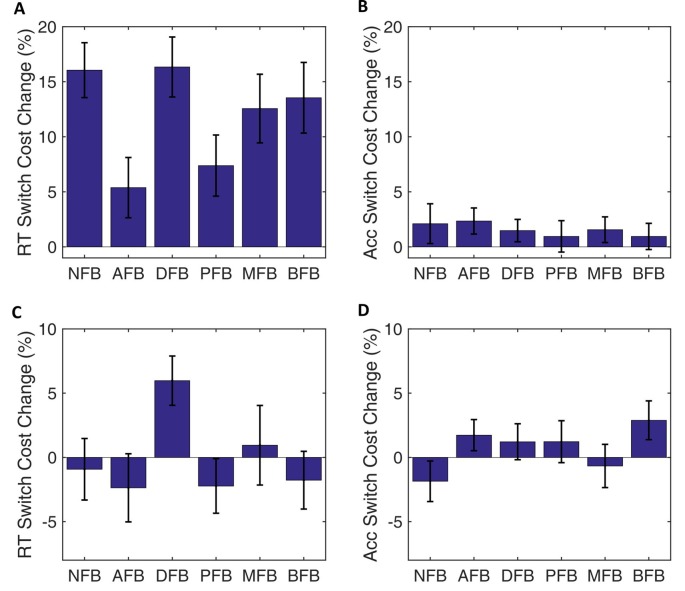
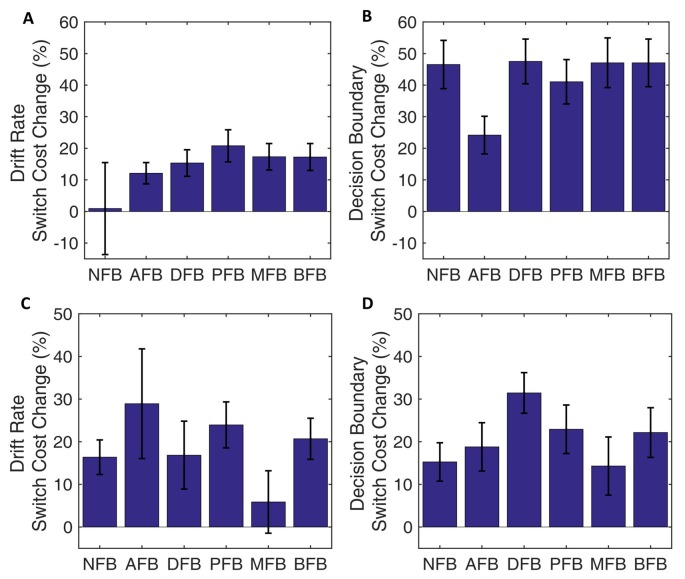
Task-switching is an important cognitive skill that facilitates our ability to choose appropriate behavior in a varied and changing environment. Task-switching training studies have sought to improve this ability by practicing switching between multiple tasks. However, an efficacious training paradigm has been difficult to develop in part due to findings that small differences in task parameters influence switching behavior in a non-trivial manner. Here, for the first time we employ the Drift Diffusion Model (DDM) to understand the influence of feedback on task-switching and investigate how drift diffusion parameters change over the course of task switch training. We trained 316 participants on a simple task where they alternated sorting stimuli by color or by shape. Feedback differed in six different ways between subjects groups, ranging from No Feedback (NFB) to a variety of manipulations addressing trial-wise vs. Block Feedback (BFB), rewards vs. punishments, payment bonuses and different payouts depending upon the trial type (switch/non-switch). While overall performance was found to be affected by feedback, no effect of feedback was found on task-switching learning. Drift Diffusion Modeling revealed that the reductions in reaction time (RT) switch cost over the course of training were driven by a continually decreasing decision boundary. Furthermore, feedback effects on RT switch cost were also driven by differences in decision boundary, but not in drift rate. These results reveal that participants systematically modified their task-switching performance without yielding an overall gain in performance.

Keywords: drift diffusion model; executive function; feedback; learning; task-switching; training.


Figures

Figure 1
Figure 1
Schematic depicting switch trials, non-switch trials and feedback conditions. A blank screen is presented for an inter-stimulus-interval (ISI) of 500–900 ms. In switch trials participants are cued to a rule change for 1000 ms while in non-switch trials no cue is presented. Afterwards a stimulus appears for 2000 ms or until a response after which feedback is presented for 750 ms according to the following conditions: in No Feedback (NFB) a blank screen; in Accuracy Feedback (AFB) a green check for correct responses and a red “x” for incorrect responses; in Difficulty Feedback (DFB) one coin for a correct response and a bonus of either one or three coins if a fast response was made and a red “x” for incorrect responses; in Punishment Feedback (PFB), the same bonuses as in the DFB but also a minus one coin for incorrect responses; in Monetary Feedback (MFB) the same feedback as PFB but each coin was worth 0.2 cents; in Block Feedback (BFB) the same feedback as PFB but also overall accuracy after each block.
Figure 2
Figure 2
Illustration of a drift-diffusion model. Thin black lines represent trajectories of individual random walks. Each walk captures noisy accumulation of evidence in time on a single trial. The speed of accumulation is determined by the drift-rate (v). A response is initiated when either of the boundaries (a or 0) is reached. The upper (blue) and lower (red) panels represent reaction time (RT) distributions for correct and incorrect responses, respectively. The time gap between the onset of a stimulus and start of the evidence accumulation is non-decision time, denoted by t0.
Figure 3
Figure 3
Behavioral data. (A,B) Average RT and percent correct by block. Results indicate a decrease in Average RT and Accuracy for switch and non-switch trials. (C,D) Switch cost is calculated by dividing switch by non-switch performance. A larger decrease in switch trials is reflected in a reduction in switch cost RT and switch cost accuracy. (E) Switch cost change is calculated by subtracting Block 10 performance from Block 1. The bar plots indicate that change in RT and accuracy switch costs are significantly greater than 0. Error bars represent within-subject errors. ***p < 0.001.
Figure 4
Figure 4
Behavioral data by condition. Average RTs and accuracy for non-switch (A,B) and switch trials (C,D) in each block and corresponding switch costs (E,F). Each color corresponds to a different condition (NFB, No feedback; AFB, Accuracy feedback; correct or incorrect feedback, DFB, Difficulty aware feedback; bonus if fast and correct, PFB, Punishment feedback; punishment, −1 coin for incorrect responses, MFB, Monetary feedback; same as PFB, but each coin is worth 0.2 cents, BFB, Block feedback; same as PFB, but at the end of each block they are given block accuracy performance).
Figure 5
Figure 5
Switch cost by condition. Change in Switch Cost from blocks 1 to 10 for RT (A) and Accuracy (B) by Condition. NFB, No Feedback; AFB, Accuracy Feedback; DFB, Difficulty Aware Feedback; MFB, Monetary Feedback; BFB, Block Feedback. Error bars represent standard errors.
Figure 6
Figure 6
Drift diffusion model (DDM) data. Group level parameters for all participants (n = 305) for switch trials (green) and non-switch trials (blue). (A,B) Results indicate a decrease in drift rate (A) and decision boundary (B). (C) A larger change in decision boundary than in drift rate from blocks 1 to 10 indicates that the decrease in RT and Accuracy is driven by a decrease in decision boundary. Error bars represent within-subject errors. ***p < 0.001.
Figure 7
Figure 7
DDM data by condition. (A–D) Group level parameters for each feedback condition for switch trials and non-switch trials, drift rate, decision boundary. Results indicate that behavioral changes by condition are primarily due to differences in decision boundary. (E) Decision boundary by condition and trial type. Results indicate an overall decrease in decision boundary as feedback motivates good performance on switch trials, with the decrease being driven by the switch trial boundary. Error bars represent within-subject errors.
Figure 8
Figure 8
Transfer behavioral data. Change in switch cost from blocks pre- to post-test blocks for RT and Accuracy by condition. (A,B) Performance for the same task (i.e., green or blue, circle or square) as in training but with no feedback. (C,D) Performance during a novel task (i.e., standing or sitting, lion or tiger) with no feedback. Results indicate that training transferred to familiar but not novel task. Error bars represent standard errors.
Figure 9
Figure 9
Transfer DDM data. Change in switch costs from pre- to post-test blocks for drift rate and decision boundary by condition. (A,B) Same task as in training blocks but with no feedback. (C,D) Novel task with no feedback. Results indicate that participants applied the same speed-accuracy trade-off as in training but there were no differences between conditions. Error bars represent standard errors.

Similar articles

Cited by

References

    1. Botvinick M., Braver T. (2015). Motivation and cognitive control: from behavior to neural mechanism. Annu. Rev. Psychol. 66, 83–113. 10.1146/annurev-psych-010814-015044 - DOI - PubMed
    1. Brainard D. H. (1997). The psychophysics toolbox. Spat. Vis. 10, 433–436. 10.1163/156856897x00357 - DOI - PubMed
    1. Cepeda N. J., Kramer A. F., Gonzalez de Sather J. C. (2001). Changes in executive control across the life span: examination of task-switching performance. Dev. Psychol. 37, 715–730. 10.1037/0012-1649.37.5.715 - DOI - PubMed
    1. Davidson M. C., Amso D., Anderson L. C., Diamond A. (2006). Development of cognitive control and executive functions from 4 to 13 years: evidence from manipulations of memory, inhibition, and task switching. Neuropsychologia 44, 2037–2078. 10.1016/j.neuropsychologia.2006.02.006 - DOI - PMC - PubMed
    1. Deveau J., Jaeggi S. M., Zordan V., Phung C., Seitz A. R. (2015). How to build better memory training games. Front. Syst. Neurosci. 8:243. 10.3389/fnsys.2014.00243 - DOI - PMC - PubMed