. 2018 Feb 2:8:956.
doi: 10.3389/fphar.2017.00956. eCollection 2017.

SMO Inhibition Modulates Cellular Plasticity and Invasiveness in Colorectal Cancer

Affiliations

SMO Inhibition Modulates Cellular Plasticity and Invasiveness in Colorectal Cancer

Paolo Magistri et al. Front Pharmacol. .

Abstract

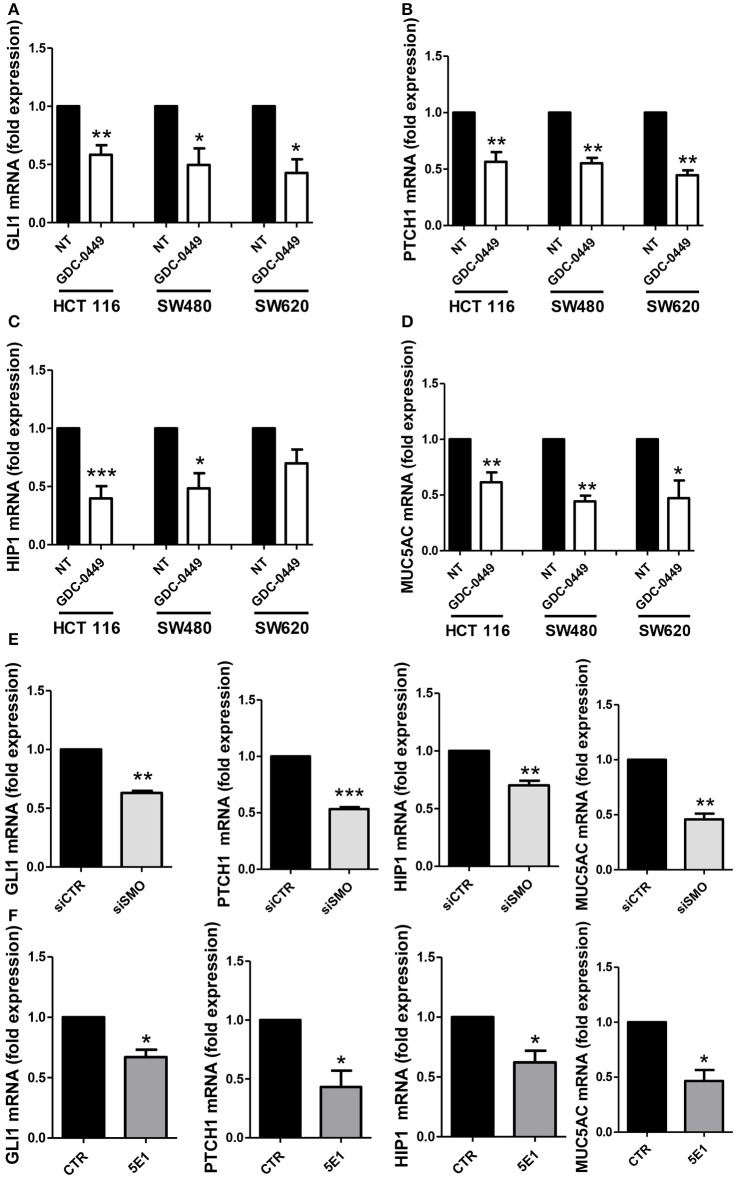
HIGHLIGHTS Preliminary results of this work were presented at the 2016 Academic Surgical Congress, Jacksonville (FL), February 2-4 2016 (Original title: Selective Smo-Inhibition Interferes With Cellular Energetic Metabolism In Colorectal Cancer)This study was funded by "Sapienza-University of Rome" (Funds for young researchers) and "AIRC" (Italian Association for Cancer Research)Hedgehog inhibitor was kindly provided by Genentech, Inc.®. Colon Cancer (CC) is the fourth most frequently diagnosed tumor and the second leading cause of death in the USA. Abnormalities of Hedgehog pathway have been demonstrated in several types of human cancers, however the role of Hedgehog (Hh) in CC remain controversial. In this study, we analyzed the association between increased mRNA expression of GLI1 and GLI2, two Hh target genes, and CC survival and recurrence by gene expression microarray from a cohort of 382 CC patients. We found that patients with increased expression of GLI1 showed a statistically significant reduction in survival. In order to demonstrate a causal role of Hh pathway activation in the pathogenesis of CC, we treated HCT 116, SW480 and SW620 CC cells lines with GDC-0449, a pharmacological inhibitor of Smoothened (SMO). Treatment with GDC-0449 markedly reduced expression of Hh target genes GLI1, PTCH1, HIP1, MUC5AC, thus indicating that this pathway is constitutively active in CC cell lines. Moreover, GDC-0449 partially reduced cell proliferation, which was associated with upregulation of p21 and downregulation of CycD1. Finally, treatment with the same drug reduced migration and three-dimensional invasion, which were associated with downregulation of Snail1, the EMT master gene, and with induction of the epithelial markers Cytokeratin-18 and E-cadherin. These results were confirmed by SMO genetic silencing. Notably, treatment with 5E1, a Sonic Hedgehog-specific mAb, markedly reduced the expression of Hedgehog target genes, as well as inhibited cell proliferation and mediated reversion toward an epithelial phenotype. This suggests the existence of a Hedgehog autocrine signaling loop affecting cell plasticity and fostering cell proliferation and migration/invasion in CC cell lines. These discoveries encourage future investigations to better characterize the role of Hedgehog in cellular plasticity and invasion during the different steps of CC pathogenesis.

Keywords: EMT; SMO inhibition; cell invasiveness; cell plasticity; colon cancer; hedgehog pathway.


Figures

Figure 1
Figure 1
Kaplan-Meier survival estimate plots for increased GLI mRNA expression in CC patients. The survival estimate was analyzed in http://www.cbioportal.org (Cerami et al., ; Gao et al., 2013) and is based on Colorectal adenocarcinoma TCGA provisional dataset, which is generated by http://cancergenome.nih.gov/. The cases were set to include tumor samples with mRNA data (RNA Seq V2, n = 382 patients). The red line shows overall survival estimate for patients with increased GLI1 expression (11% of the patients) as compared to patients with no alteration (blue line, the rest of the patients). Eight patients were missing in the survival analysis. The threshold for altered expression was set to z-score value = 1.2 The z-score value is used to define the cut-off for patient dichotomization in the TCGA datasets (see http://www.cbioportal.org/). The median months survival for the increased GLI1 patient group and the reference group were 47.04 and 92.67, respectively. Survival analysis significance was based on Logrank Test. P < 0.05 was considered significant.
Figure 2
Figure 2
Effect of Hh inhibition on Hh pathway-induced genes. HCT 116, SW480 and SW620 were treated with DMSO vehicle (NT) or with 1 μM GDC-0449 for 24 h. Expression of GLI1 (A), PTCH1 (B), HIP1 (C), MUC5AC (D) was evaluated on total RNA by qRT-PCR. Bars represent means ± SEM of 7 experiment for HCT 116 cells, three experiments for SW480 and SW620 cells. Expression of GLI1, PTCH1, HIP1, MUC5AC in HCT 116 cells transfected with either control or specific SMO-targeting siRNAs (E). Expression of GLI1, PTCH1, HIP1, MUC5AC in HCT 116 cells treated with either isotype-control mAb or 5E1 mAB (F). Bars represent means ± SEM of three experiments. *P < 0.05, **P < 0.01, ***P < 0.001.
Figure 3
Figure 3
Effect of Hh inhibition on cell proliferation. (A) HCT 116, (B) SW480, (C) SW620 or (D) MeT5A cells were treated with vehicle (DMSO) or with GDC-0449 (1 μM) for 24–48 h. Cell proliferation was evaluated through microscopic count of living cells. Three independent experiments for each cell line were performed. Expression of Cyclin D1 (E) and p21 (F) was evaluated on total RNA by qRT-PCR. Bars represent means ± SEM of 7 experiment for HCT 116 cells, three experiments for SW480 and SW620 cells. (G) Expression of Cyclin D1 mRNA was evaluated in HCT 116 cells transfected with either control or specific SMO-targeting siRNAs (left), or in HCT 116 cells treated with either isotype-control mAb or 5E1 mAb (10 μg/ml) (right). (H) Expression of p21 mRNA was evaluated in HCT 116 cells transfected with either control or specific SMO-targeting siRNAs (left), or in HCT 116 cells treated with either isotype-control mAb or 5E1 mAb (10 μg/ml) (right). Bars represent means ± SEM of three independent experiments. *P < 0.05, **P < 0.01.
Figure 4
Figure 4
Effect of Hh inhibition on cell directed migration and on EMT-MET dynamics. (A) HCT 116 cells were treated with vehicle (DMSO) or with GDC-0449 (1 μM) in culture medium supplemented with 0.5% FCS. A scratch was performed and micrographs were taken 24 h after the scratch. Wound closure rate was quantified (right). Three independent experiments were performed. (B) HCT 116 cells were pretreated with GDC-0449 for 24 h and then overlaid with a Matrigel matrix. Invasion was monitored over 72 h. Three-dimensional invasion was enhanced by adding 20% FCS to the wells on top of Matrigel. Cells were stained with phalloidin (green) and Hoechst 33342 (cell nuclei, blue). Scale bar: 100 μm. 3 dimensional invasion rate was quantified (right). Three independent experiments were performed. (C,D) Effect of GDC-0449 on genes related to EMT-MET dynamics. (C) HCT 116, SW480, and SW620 cells were treated with GDC-0449 (1 μM) or DMSO for 24 h. Expression of Snail1 mRNA was evaluated on total RNA by qRT-PCR. Bars represent means ± SEM of 7 experiment for HCT 116 cells, three experiments for SW480 and SW620 cells. (D) Expression of Snail1 and E–cadherin in cells treated as above by western blot on total protein lysates of HCT 116 cells treated as stated in the figure. Tubulin was used as a loading control. Three independent experiments were performed. Quantification of E-cadherin and Snail1 protein expression is shown below. (E) Expression of Cytokeratin 18 (CK18) mRNA from total RNA of HCT 116 cells treated as in (C). (F) Cytokeratin expression and localization in HCT 116 cells was evaluated through immunofluorescence analysis. Nuclei were stained in blue with Hoechst. Quantification of Cytokeratin mean intensity is shown on the right. Two independent experiments were performed. *P < 0.05, **P < 0.01.
Figure 5
Figure 5
(A) Snail1 and (B) Cytokeratin 18 expression was evaluated on total RNA by qRT-PCR from HCT 116 cells transfected with either control or specific SMO-targeting siRNAs (left), or from cells treated with either isotype-control mAb or 5E1 mAb (10 μg/ml) (right) (n = 3). (C) Western blot showing expression of SMO, E-cadherin, Snail1 in HCT 116 cells transfected with either control or specific SMO-targeting siRNAs. Quantification of SMO, E-cadherin and Snail1 is shown on the left. (n = 3). (D) Western blot showing the expression of E-cadherin, Snail1 in HCT 116 cells treated with either isotype-control mAb or 5E1 mAb (10 μg/ml). Tubulin was used as loading control. E-cadherin and Snail1 quantifications are shown on the right. Bars represent means ± SEM of three independent experiments.*P < 0.05, **P < 0.01.

Similar articles

Cited by

References

    1. Alinger B., Kiesslich T., Datz C., Aberger F., Strasser F., Berr F., et al. . (2009). Hedgehog signaling is involved in differentiation of normal colonic tissue rather than in tumor proliferation. Virchows Archiv. 454, 369–379. 10.1007/s00428-009-0753-7 - DOI - PubMed
    1. Al-Sohaily S., Biankin A., Leong R., Kohonen-Corish M., Warusavitarne J. (2012). Molecular pathways in colorectal cancer. J. Gastroenterol. Hepatol. 27, 1423–1431. 10.1111/j.1440-1746.2012.07200.x - DOI - PubMed
    1. Amakye D., Jagani Z., Dorsch M. (2013). Unraveling the therapeutic potential of the Hedgehog pathway in cancer. Nat. Med. 19, 1410–1422. 10.1038/nm.3389 - DOI - PubMed
    1. Battistelli C., Cicchini C., Santangelo L., Tramontano A., Grassi L., Gonzalez F. J., et al. . (2017). The Snail repressor recruits EZH2 to specific genomic sites through the enrollment of the lncRNA HOTAIR in epithelial-to-mesenchymal transition. Oncogene 36, 942–955. 10.1038/onc.2016.260 - DOI - PMC - PubMed
    1. Benvenuto M., Masuelli L., De Smaele E., Fantini M., Mattera R., Cucchi D., et al. . (2016). In vitro and in vivo inhibition of breast cancer cell growth by targeting the Hedgehog/GLI pathway with SMO (GDC-0449) or GLI (GANT-61) inhibitors. Oncotarget 7, 9250–9270. 10.18632/oncotarget.7062 - DOI - PMC - PubMed