

High throughput imaging cytometer with acoustic focussing
- PMID: 29456838
- PMCID: PMC5782801
- DOI: 10.1039/c5ra19497k
High throughput imaging cytometer with acoustic focussing
Abstract
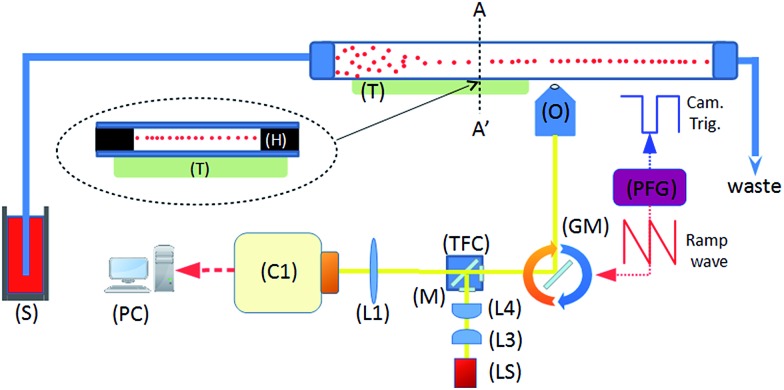
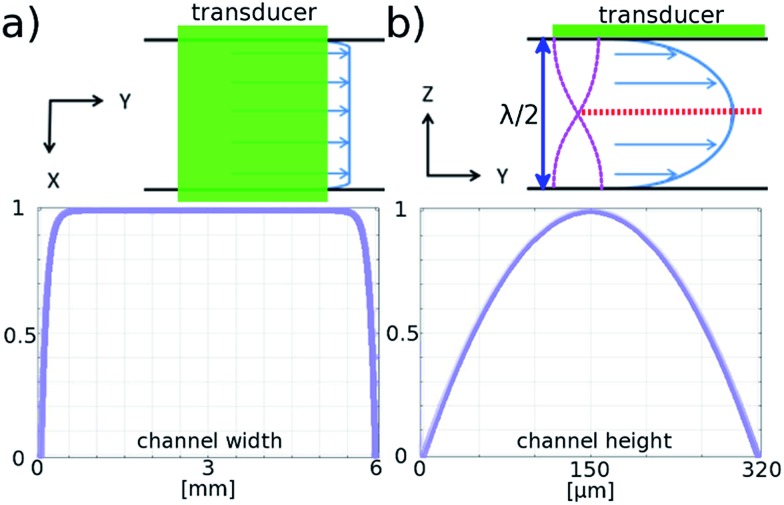
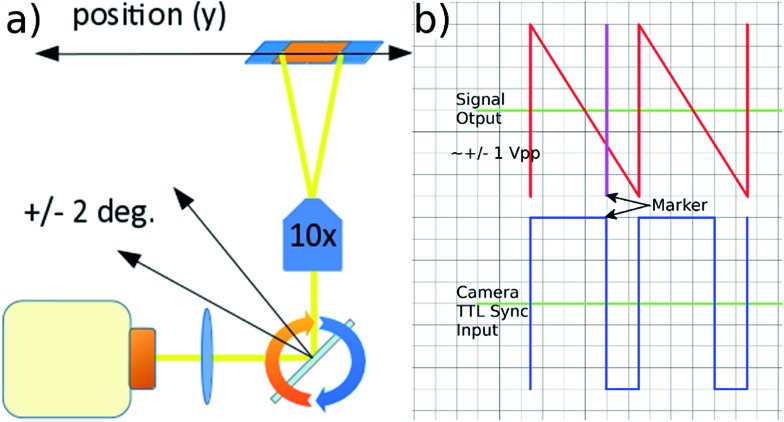
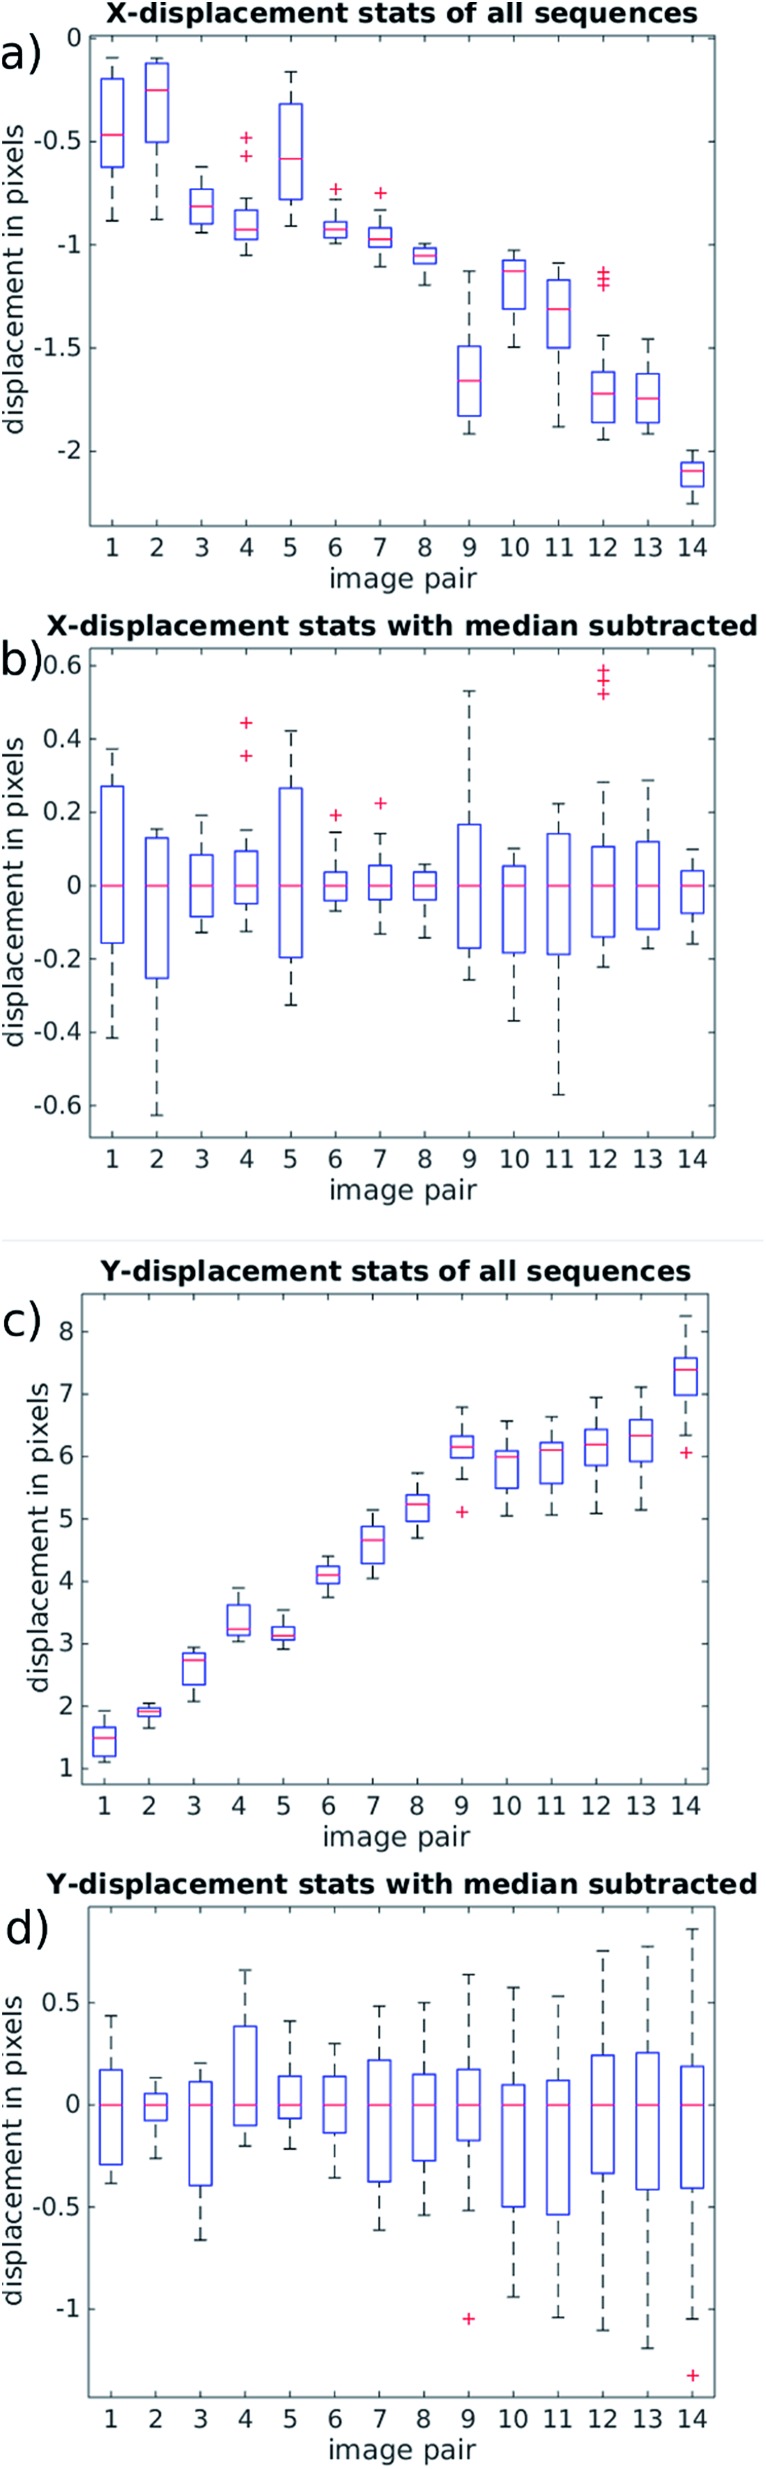
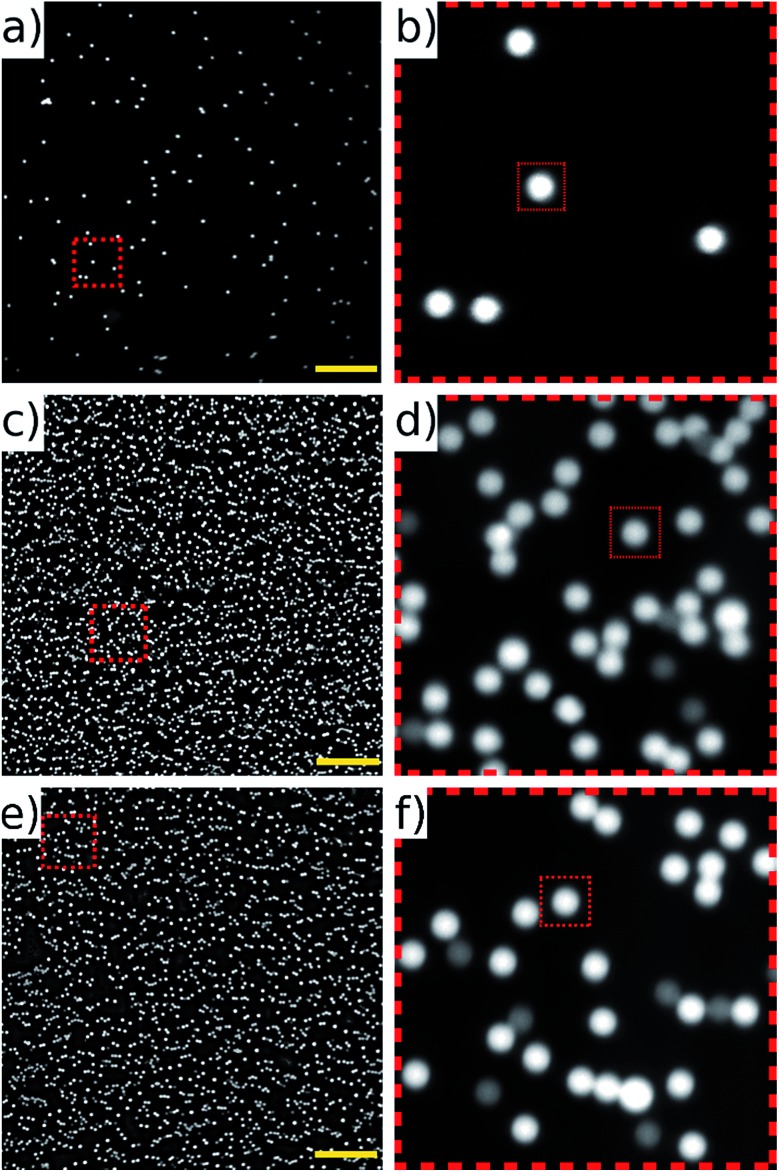
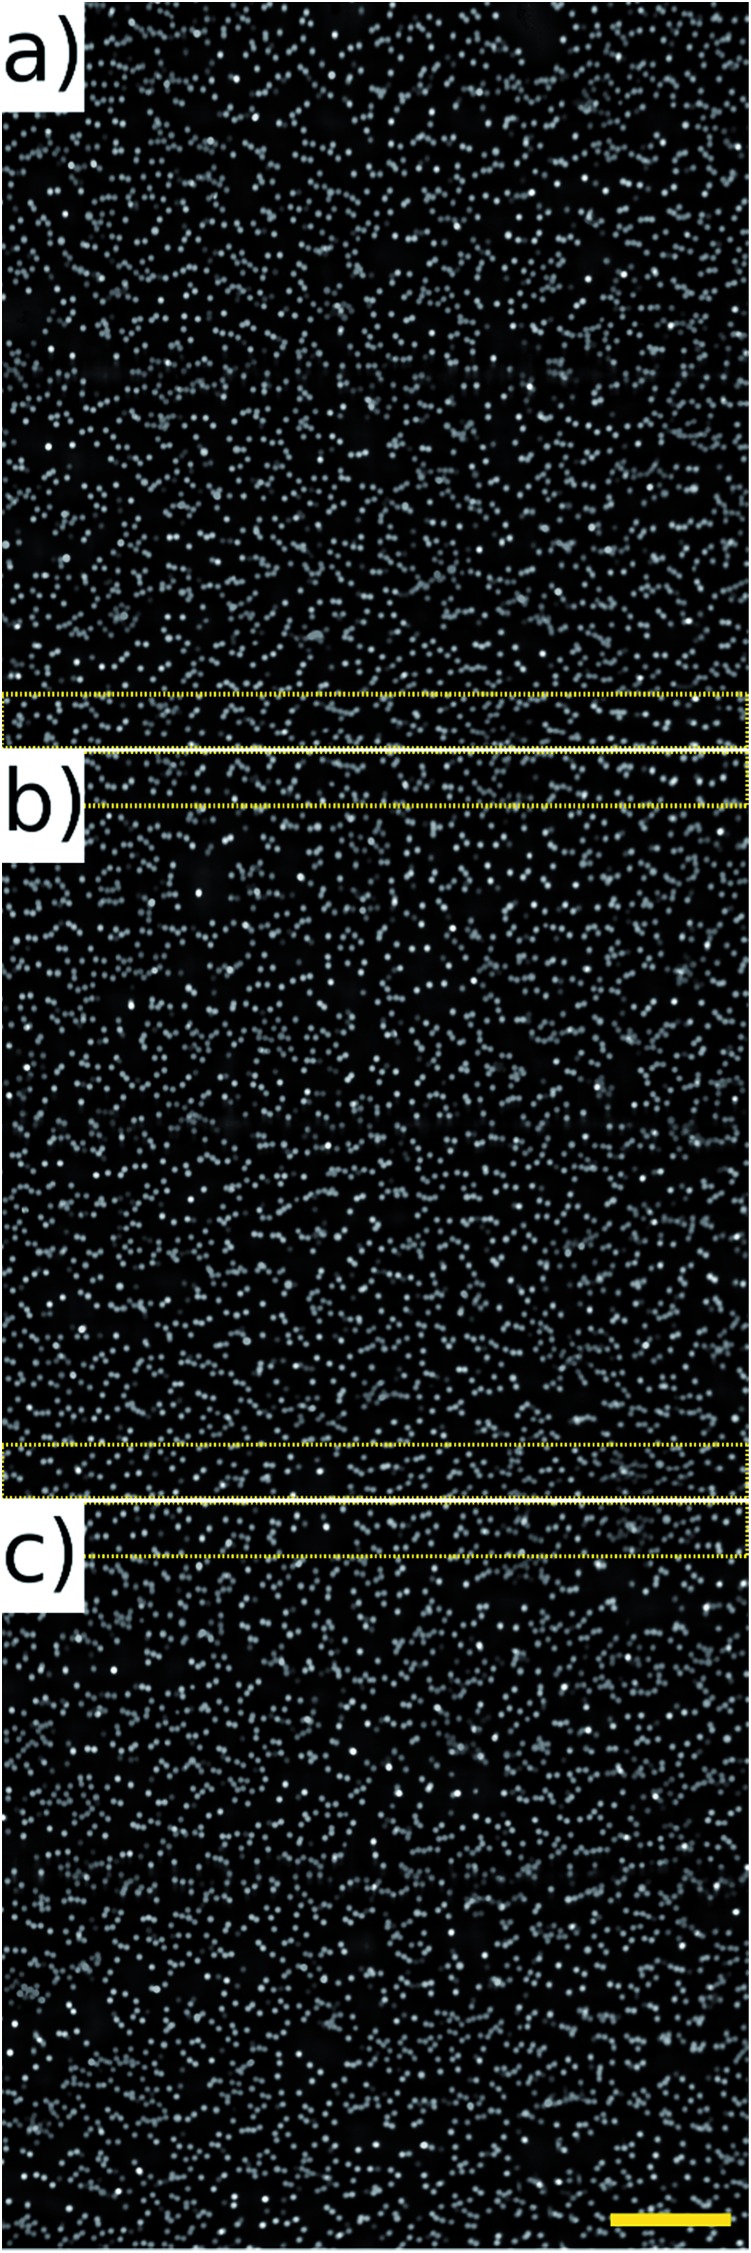
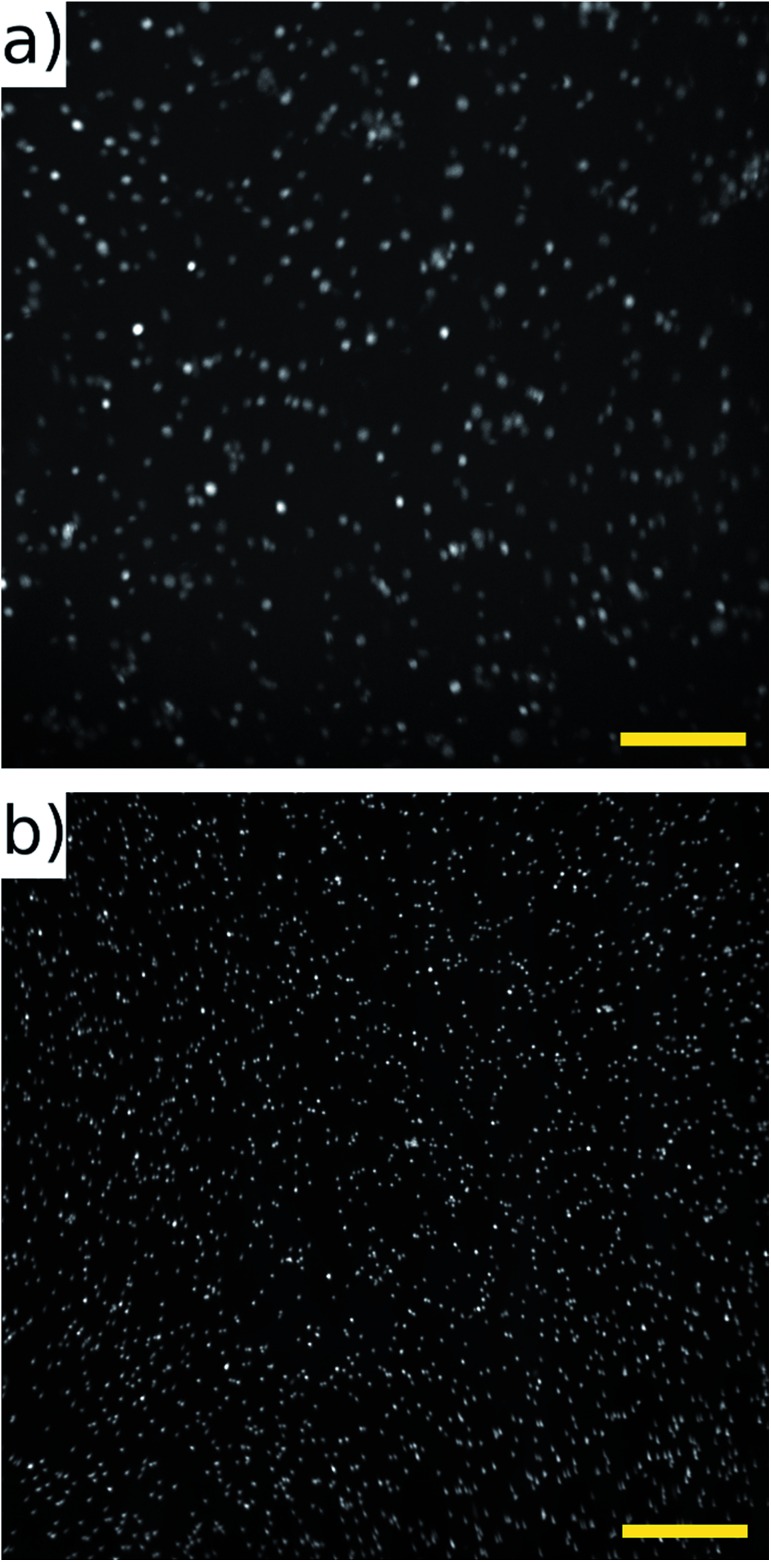
We demonstrate an imaging flow cytometer that uses acoustic levitation to assemble cells and other particles into a sheet structure. This technique enables a high resolution, low noise CMOS camera to capture images of thousands of cells with each frame. While ultrasonic focussing has previously been demonstrated for 1D cytometry systems, extending the technology to a planar, much higher throughput format and integrating imaging is non-trivial, and represents a significant jump forward in capability, leading to diagnostic possibilities not achievable with current systems. A galvo mirror is used to track the images of the moving cells permitting exposure times of 10 ms at frame rates of 50 fps with motion blur of only a few pixels. At 80 fps, we demonstrate a throughput of 208 000 beads per second. We investigate the factors affecting motion blur and throughput, and demonstrate the system with fluorescent beads, leukaemia cells and a chondrocyte cell line. Cells require more time to reach the acoustic focus than beads, resulting in lower throughputs; however a longer device would remove this constraint.
Figures
Similar articles
-
Webcam-based flow cytometer using wide-field imaging for low cell number detection at high throughput.Analyst. 2014 Sep 7;139(17):4322-9. doi: 10.1039/c4an00669k. Analyst. 2014. PMID: 24995370
-
Motion-Blur-Free High-Speed Video Shooting Using a Resonant Mirror.Sensors (Basel). 2017 Oct 29;17(11):2483. doi: 10.3390/s17112483. Sensors (Basel). 2017. PMID: 29109385 Free PMC article.
-
High-Throughput Parallel Optofluidic 3D-Imaging Flow Cytometry.Small Sci. 2022 Jun 5;2(7):2100126. doi: 10.1002/smsc.202100126. eCollection 2022 Jul. Small Sci. 2022. PMID: 40213114 Free PMC article.
-
High throughput single-cell and multiple-cell micro-encapsulation.J Vis Exp. 2012 Jun 15;(64):e4096. doi: 10.3791/4096. J Vis Exp. 2012. PMID: 22733254 Free PMC article.
-
Gantry rotational motion-induced blur in cone-beam computed tomography.Proc SPIE Int Soc Opt Eng. 2018 Feb;10573:105734B. doi: 10.1117/12.2293580. Epub 2018 Mar 9. Proc SPIE Int Soc Opt Eng. 2018. PMID: 29928070 Free PMC article.
Cited by
-
Standing Surface Acoustic Wave (SSAW)-Based Fluorescence-Activated Cell Sorter.Small. 2018 Oct;14(40):e1801996. doi: 10.1002/smll.201801996. Epub 2018 Aug 31. Small. 2018. PMID: 30168662 Free PMC article.
-
Acoustofluidic phase microscopy in a tilted segmentation-free configuration.Biomicrofluidics. 2021 Jan 5;15(1):014102. doi: 10.1063/5.0036585. eCollection 2021 Jan. Biomicrofluidics. 2021. PMID: 33456640 Free PMC article.
-
A Microfluidics Approach for Ovarian Cancer Immune Monitoring in an Outpatient Setting.Cells. 2023 Dec 20;13(1):7. doi: 10.3390/cells13010007. Cells. 2023. PMID: 38201211 Free PMC article.
-
Acoustofluidic methods in cell analysis.Trends Analyt Chem. 2019 Aug;117:280-290. doi: 10.1016/j.trac.2019.06.034. Epub 2019 Jul 13. Trends Analyt Chem. 2019. PMID: 32461706 Free PMC article.
-
Line-Focused Optical Excitation of Parallel Acoustic Focused Sample Streams for High Volumetric and Analytical Rate Flow Cytometry.Anal Chem. 2017 Sep 19;89(18):9967-9975. doi: 10.1021/acs.analchem.7b02319. Epub 2017 Sep 5. Anal Chem. 2017. PMID: 28823146 Free PMC article.
References
-
- Manso L., Tusquets I., de la Piedra C., Crespo C., Gomez P., Calvo L., Galve E., Borrego M. R., Rifa J., Barnadas A. Eur. J. Cancer. 2011;47:S337.
-
- Danova M., Torchio M., Mazzini G. Expert Rev. Mol. Diagn. 2011;11:473–485. - PubMed
LinkOut - more resources
Full Text Sources
Other Literature Sources
Miscellaneous