. 2018 Feb 2:4:97.
doi: 10.3389/fmolb.2017.00097. eCollection 2017.

The Molecular Bases of the Dual Regulation of Bacterial Iron Sulfur Cluster Biogenesis by CyaY and IscX

Affiliations

The Molecular Bases of the Dual Regulation of Bacterial Iron Sulfur Cluster Biogenesis by CyaY and IscX

Salvatore Adinolfi et al. Front Mol Biosci. .

Abstract

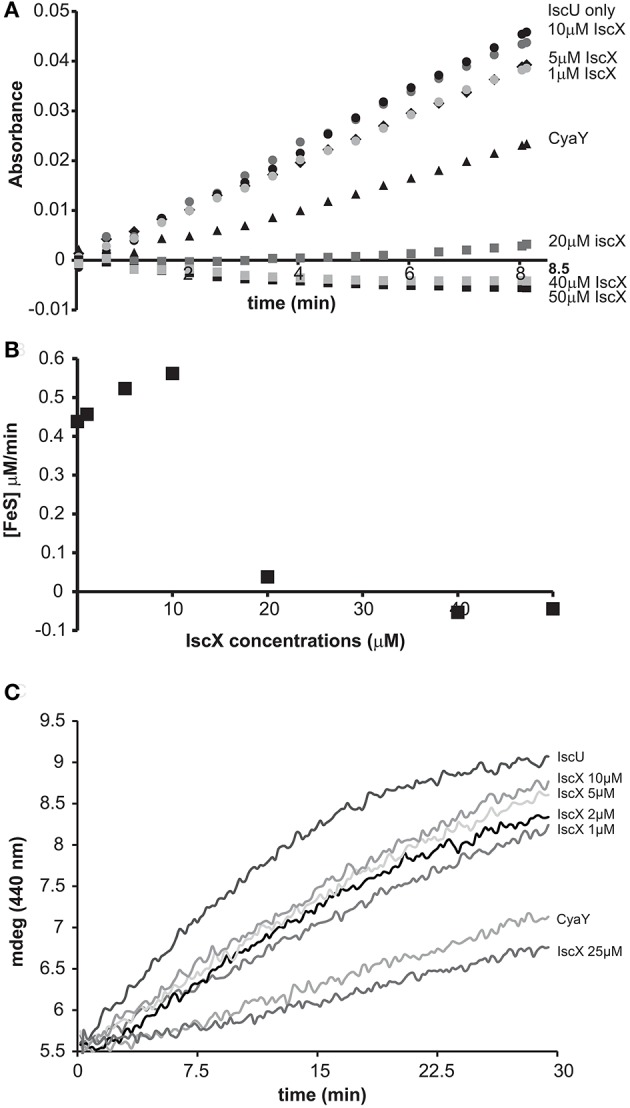
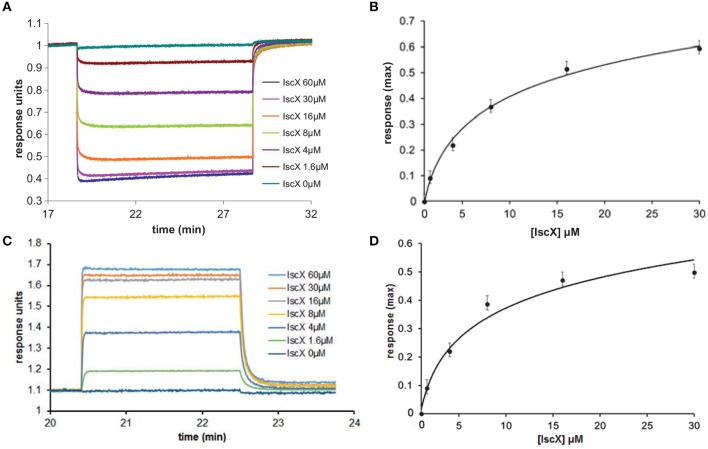
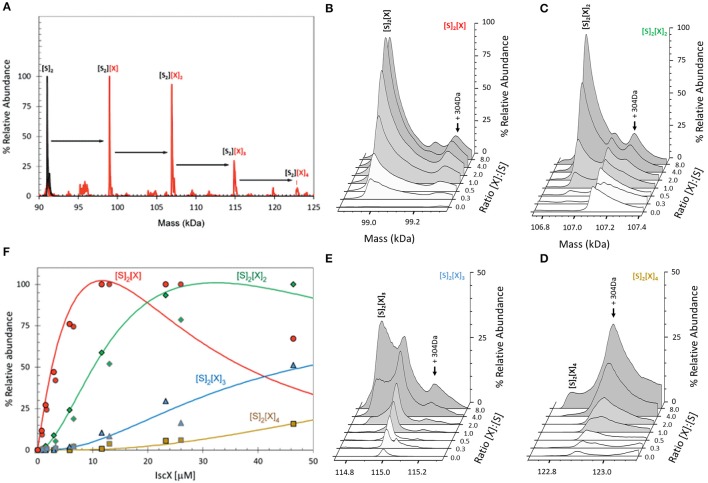
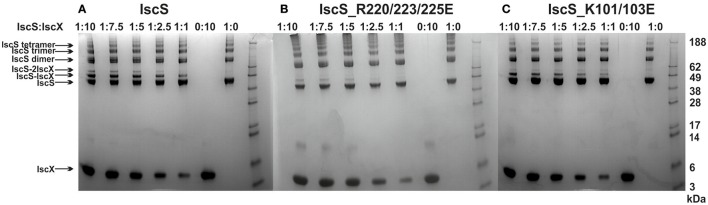
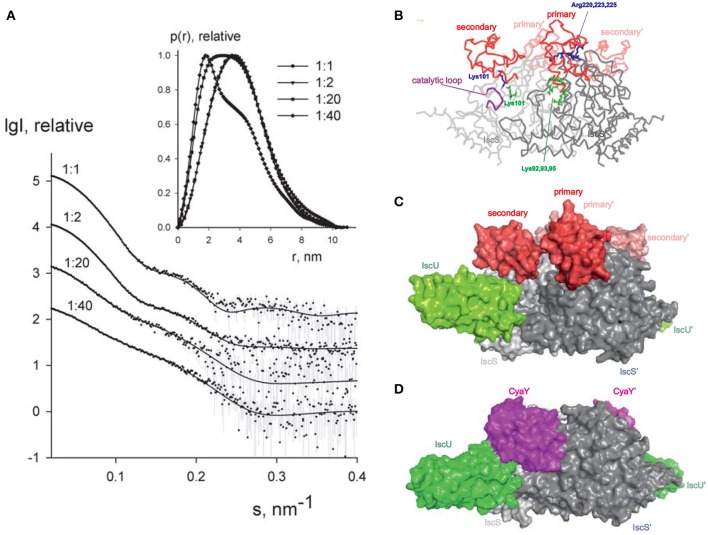
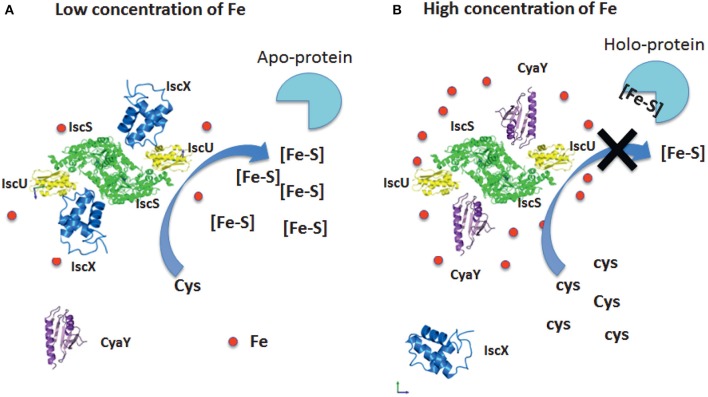
IscX (or YfhJ) is a protein of unknown function which takes part in the iron-sulfur cluster assembly machinery, a highly specialized and essential metabolic pathway. IscX binds to iron with low affinity and interacts with IscS, the desulfurase central to cluster assembly. Previous studies have suggested a competition between IscX and CyaY, the bacterial ortholog of frataxin, for the same binding surface of IscS. This competition could suggest a link between the two proteins with a functional significance. Using a hybrid approach based on nuclear magnetic resonance, small angle scattering and biochemical methods, we show here that IscX is a modulator of the inhibitory properties of CyaY: by competing for the same site on IscS, the presence of IscX rescues the rates of enzymatic cluster formation which are inhibited by CyaY. The effect is stronger at low iron concentrations, whereas it becomes negligible at high iron concentrations. These results strongly suggest the mechanism of the dual regulation of iron sulfur cluster assembly under the control of iron as the effector.

Keywords: desulfurase; enzyme activity; frataxin; iron chaperone; iron sulfur cluster; isc operon.


Figures

Figure 1
Figure 1
Effect of increasing concentrations of IscX on the enzymatic kinetics of Fe-S cluster formation on IscU. (A) Kinetics of cluster formation at increasing concentrations of IscX as measured by absorbance at room temperature. (B) Plot of the initial rates at increasing concentrations of IscX. Negative values are due to imperfect subtraction from the baseline and should be considered as zero (full inhibition). Only the initial part of the kinetics for each IscX concentration point was considered. The slope of these linear regions (for each IscX concentration) was used as the initial velocity. A molar extinction coefficient of 10.5 mM−1 cm−1 was assumed to convert the absorbance in concentration of Fe-S cluster produced. (C) Kinetics followed by CD. The assays were carried out using 1 μM IscS, 50 μM IscU, 250 μM Cys, 2 mM DTT, and 25 μM Fe2+ and increasing concentrations of IscX as indicated. For comparison, the experiment was also repeated in the presence of 5 μM CyaY. The error bars are not shown for sake of clarity but were typically within 5% or less.
Figure 2
Figure 2
Quantification of the binding affinities of the IscX-IscS-IscU and IscX-IscS complexes to assess the influence of a third component. (A) Plot of the interferometry response obtained by immobilizing CyaY saturated by IscS (10 μM) and titrating with increasing concentrations of IscX (0–60 μM). (B) Plot of the response reduction as a function of IscX concentration. (C) Plot of the interferometry response obtained by immobilizing IscS saturated by IscU (10 μM) and titrating with increasing concentrations of IscX (0–60 μM). (D) Plot of the response as a function of IscX concentrations.
Figure 3
Figure 3
ESI-MS investigation of complex formation between IscS and IscX. (A) Deconvoluted mass spectrum of IscS over the mass range 90–125 kDa, showing the presence of the IscS dimer (black spectrum). Addition of IscX at an 8:1 excess gave rise to a series of IscX-IscS complexes in which the IscS dimer is bound by 1–4 IscX protein molecules (red spectrum). (B–E) Deconvoluted mass spectra at increasing ratios of IscX to IscS showing the formation/decay of the four IscX-IscS complexes, as indicated. A +340 Da adduct species is present in each of the spectra, including that of the IscS dimer, indicating that it originates from IscS. The precise nature of the adduct is unknown, but it is likely to arise from two β-mercaptoethanol hetero-disulfides per IscS (4 × 76 = 304 Da), as the protein is in a solution containing 20 mM β-mercaptoethanol. (F) Plots of relative intensity of the four IscX-IscS complexes, as indicated, as a function of IscX concentration. Solid lines show fits of the data to a sequential binding model for 1–4 IscX per IscS dimer. IscS (3 μM) was in 250 mM ammonium acetate, pH 8. Note that abundances are reported relative to the most abundant species, which is arbitrarily set to 100%.
Figure 4
Figure 4
Cross-linking experiments to identify the interacting sites on IscX and IscS using different relative concentrations of IscS and IscX. (A) Experiments using wild-type IscS (8 μM) and IscX at molar ratios 1:10, 1:7.5, 1:5, 1:2.5, and 1:1 from left to right. The last two lanes on the right are the controls carried out using isolated IscS and IscX. As expected the IscS dimer disassembles in SDS and runs as a monomer of ca. 45 kDa. (B) The same as in A but with the IscS_R220/223/225E mutant. (C) The same as in A but with the IscS_K101/105E mutant. The markers are indicated on the right.
Figure 5
Figure 5
SAXS measurements. (A) X-ray scattering patterns for IscX-IscS at molar ratios of 1:1 (at 5 mg/ml solute concentration), 2:1 (at 3 mg/ml), 20:1 and 40:1 (both at 0.5 mg/ml). The experimental data are displayed as dots with error bars. The scattering from a mixture of two rigid body models (1:1 and 2:1 IscX-IscS complexes) obtained by SASREFMX (for data with 1:1 molar ratio) and the fits by mixtures of unbound IscX, IscS dimers, and 1:1/2:1 rigid body complexes (for data at 2:1, 20:1, and 40:1 molar ratios) as obtained by OLIGOMER are shown by solid lines. The plots display the logarithm of the scattering intensity as a function of the momentum transfer. The distance distribution functions are indicated in the insert. (B) Backbone representation of the 2:1 IscX-IscS complex. The two IscS protomers are shown in different shades of gray. Residues which are either involved in cross-linking or have an effect on binding are indicated. The catalytic loop of IscS is indicated in purple. (C) Same as in (B) in a full atom representation. For reference, IscU (in green) is included (3LVL) to clarify the relative positions of the components. (D) Comparison with the model previously obtained for the ternary complex CyaY-IscS-IscU (Shi et al., 2010). Light and dark gray represent each of the protomers of the IscS dimer.
Figure 6
Figure 6
Competition between IscX and CyaY. (A) Assay carried out using 25 μM Fe2+ in the co-presence of CyaY (5 μM) and increasing concentrations of IscX in the range 0–50 μM. When both CyaY and IscX are present, there is a competition which, under otherwise the same conditions, depends on the IscX:CyaY ratios. (B) As in (A) but with the concentration of IscX fixed to 5 μM and various concentrations of CyaY. (C) Enzyme kinetics carried out with concentration ratios similar to those observed in the cell (4.1 μM IscS, 250 μM Cys, 2 mM DTT, 1.0 μM IscX, 0.7 μM CyaY, and 25 μM Fe2+).
Figure 7
Figure 7
Iron dependence of the relative effect of CyaY and IscX on cluster assembly enzymatic kinetics on IscU. (A) Initial rates of kinetics of cluster formation on IscU as a function of iron concentration in the presence of IscU only (gray circle), IscU and CyaY (black rectangles) and IscU, IscX, and CyaY (gray triangles). (B) The same as in (A) but expanded for clarity. (C) Assays carried out in the absence and in the presence of IscX (1 μM) at increasing concentrations of iron (10 μM, 25 μM, 50 μM, 80 μM) to assess whether IscX is affected by iron. No CyaY was added to the assay. All experiment contained 1 μM IscS, 50 μM IscU, 250 μM Cys, 2 mM DTT.
Figure 8
Figure 8
Model of the relative roles of CyaY and IscX. (A) At low iron concentrations, the system is under the control of IscX, which fills the binding site and impedes binding of CyaY. (B) At high iron concentrations, the system becomes under the control of CyaY.

References

    1. Adinolfi S., Iannuzzi C., Prischi F., Pastore C., Iametti S., Martin S., et al. . (2009). Bacterial frataxin CyaY is the gatekeeper of iron-sulfur cluster formation catalyzed by IscS. Nat. Struct. Mol. Biol. 16, 390–396. 10.1038/nsmb.1579 - DOI - PubMed
    1. Agar J. N., Krebs C., Frazzon J., Huynh B. H., Dean D. R., Johnson M. K. (2000). IscU as a scaffold for iron-sulfur cluster biosynthesis: sequential assembly of [2Fe-2S] and [4Fe-4S] clusters in IscU. Biochemistry 39, 7856–7862. 10.1021/bi000931n - DOI - PubMed
    1. Beinert H. (2000). Iron-sulfur proteins: ancient structures, still full of surprises. J. Biol. Inorg. Chem. 5, 2–15. 10.1007/s007750050002 - DOI - PubMed
    1. Blanchet C. E., Spilotros A., Schwemmer F., Graewert M. A., Kikhney A., Svergun D. I., et al. . (2015). Versatile sample environments and automation for biological solution X-ray scattering experiments at the P12 beamline (PETRA III, DESY). J. Appl. Crystallogr. 48(Pt 2), 431–443. 10.1107/S160057671500254X - DOI - PMC - PubMed
    1. Bridwell-Rabb J., Iannuzzi C., Pastore A., Barondeau D. P. (2012). Effector role reversal during evolution: the case of frataxin in Fe-S cluster biosynthesis. Biochemistry 51, 2506–2514. 10.1021/bi201628j - DOI - PMC - PubMed