

Radiomics analysis of pulmonary nodules in low-dose CT for early detection of lung cancer
- PMID: 29457229
- PMCID: PMC5903960
- DOI: 10.1002/mp.12820
Radiomics analysis of pulmonary nodules in low-dose CT for early detection of lung cancer
Abstract
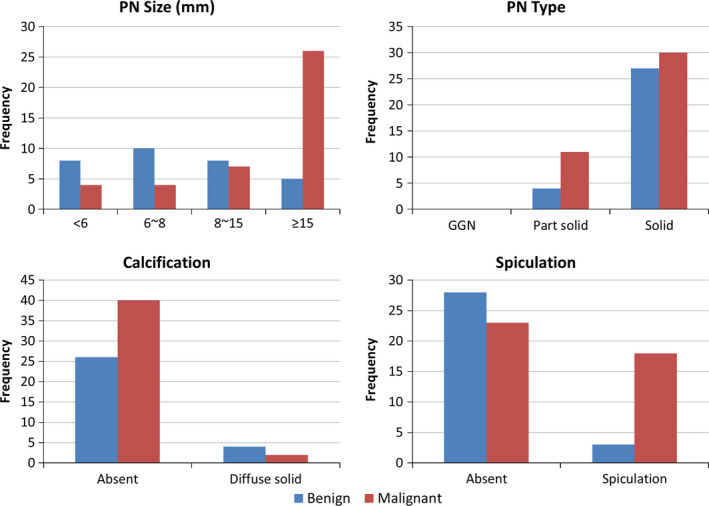
Purpose: To develop a radiomics prediction model to improve pulmonary nodule (PN) classification in low-dose CT. To compare the model with the American College of Radiology (ACR) Lung CT Screening Reporting and Data System (Lung-RADS) for early detection of lung cancer.
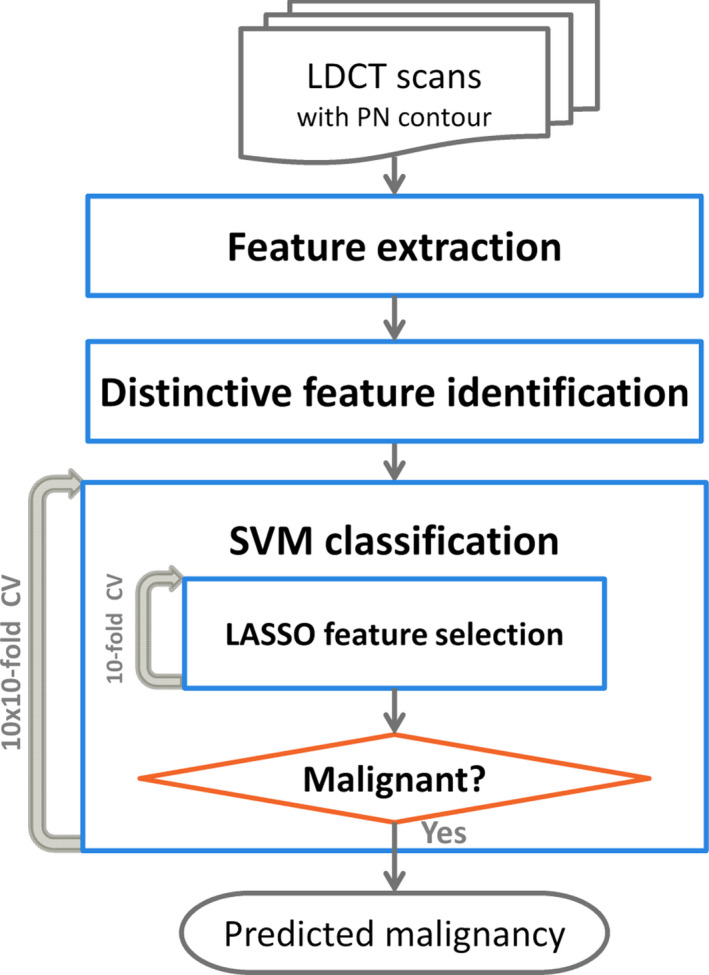
Methods: We examined a set of 72 PNs (31 benign and 41 malignant) from the Lung Image Database Consortium image collection (LIDC-IDRI). One hundred three CT radiomic features were extracted from each PN. Before the model building process, distinctive features were identified using a hierarchical clustering method. We then constructed a prediction model by using a support vector machine (SVM) classifier coupled with a least absolute shrinkage and selection operator (LASSO). A tenfold cross-validation (CV) was repeated ten times (10 × 10-fold CV) to evaluate the accuracy of the SVM-LASSO model. Finally, the best model from the 10 × 10-fold CV was further evaluated using 20 × 5- and 50 × 2-fold CVs.
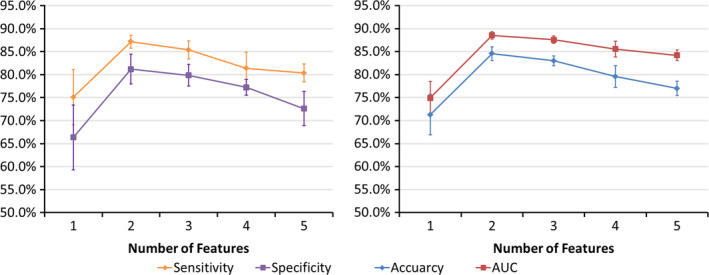
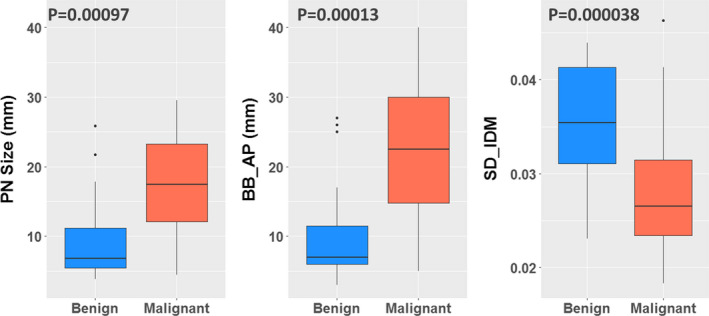
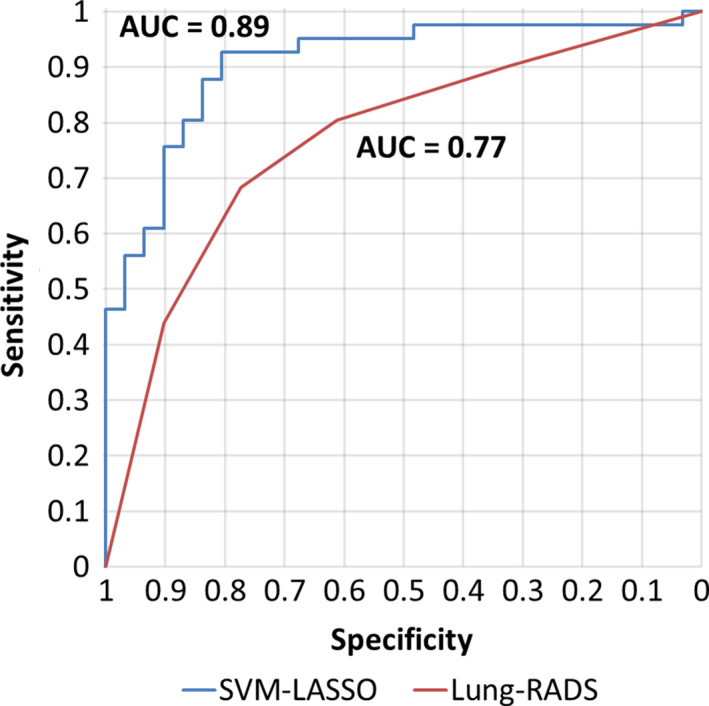
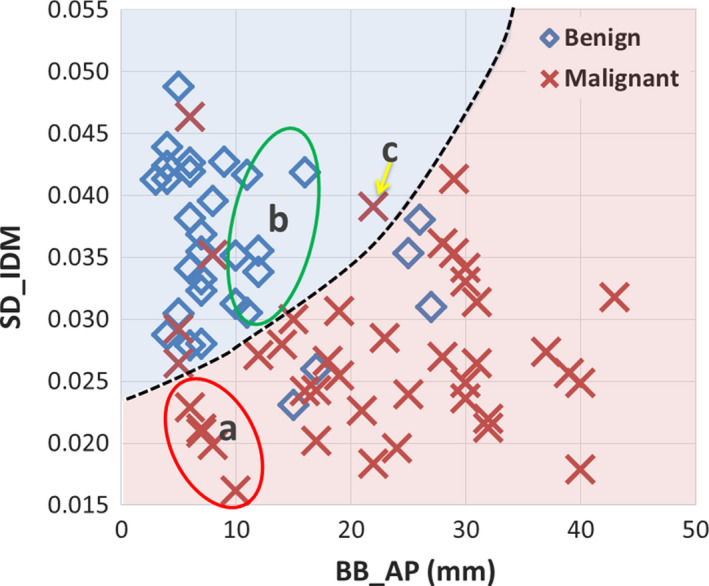
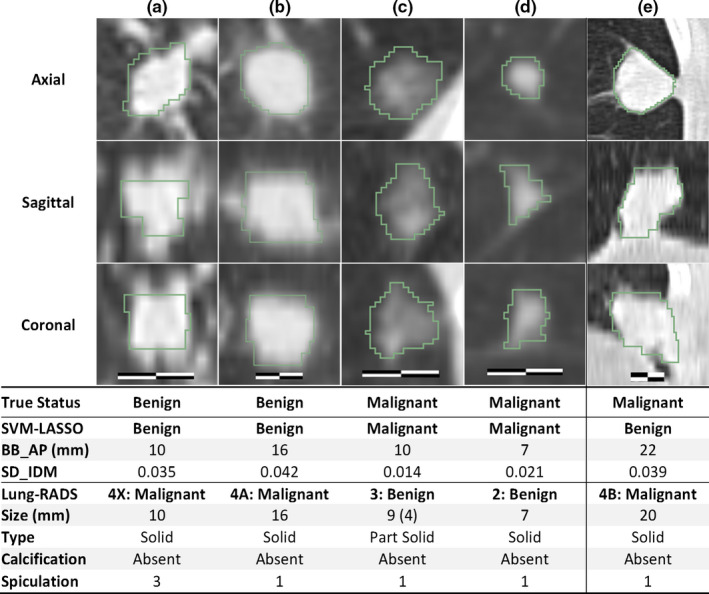
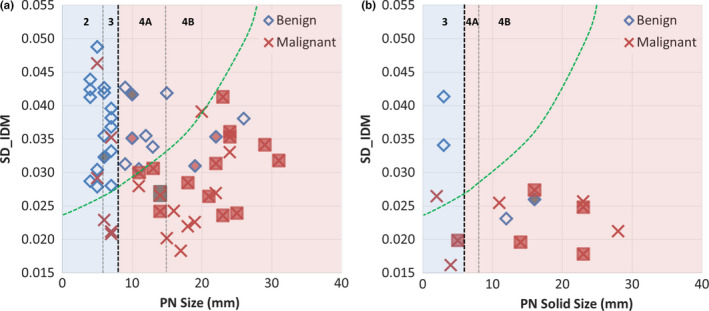
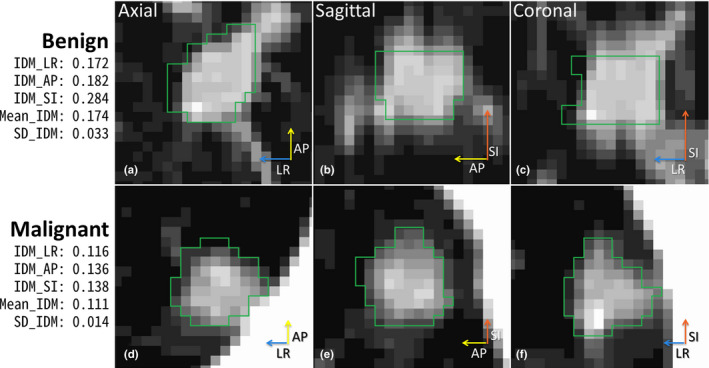
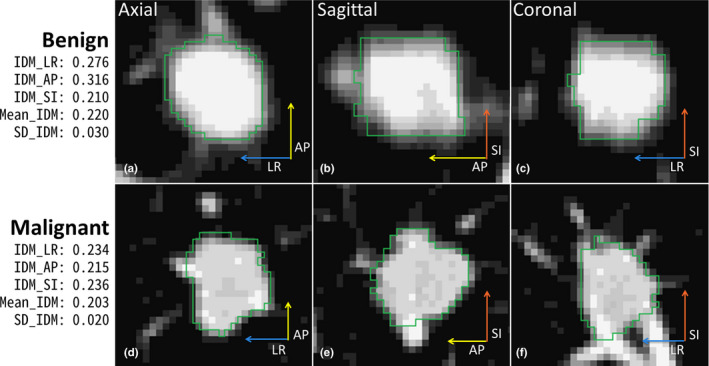
Results: The best SVM-LASSO model consisted of only two features: the bounding box anterior-posterior dimension (BB_AP) and the standard deviation of inverse difference moment (SD_IDM). The BB_AP measured the extension of a PN in the anterior-posterior direction and was highly correlated (r = 0.94) with the PN size. The SD_IDM was a texture feature that measured the directional variation of the local homogeneity feature IDM. Univariate analysis showed that both features were statistically significant and discriminative (P = 0.00013 and 0.000038, respectively). PNs with larger BB_AP or smaller SD_IDM were more likely malignant. The 10 × 10-fold CV of the best SVM model using the two features achieved an accuracy of 84.6% and 0.89 AUC. By comparison, Lung-RADS achieved an accuracy of 72.2% and 0.77 AUC using four features (size, type, calcification, and spiculation). The prediction improvement of SVM-LASSO comparing to Lung-RADS was statistically significant (McNemar's test P = 0.026). Lung-RADS misclassified 19 cases because it was mainly based on PN size, whereas the SVM-LASSO model correctly classified 10 of these cases by combining a size (BB_AP) feature and a texture (SD_IDM) feature. The performance of the SVM-LASSO model was stable when leaving more patients out with five- and twofold CVs (accuracy 84.1% and 81.6%, respectively).
Conclusion: We developed an SVM-LASSO model to predict malignancy of PNs with two CT radiomic features. We demonstrated that the model achieved an accuracy of 84.6%, which was 12.4% higher than Lung-RADS.
Keywords: CT; SVM; lung cancer; pulmonary nodule; radiomics.
© 2018 American Association of Physicists in Medicine.
Conflict of interest statement
The authors have no relevant conflicts of interest to disclose.
Figures
Similar articles
-
Radiomic features add incremental benefit to conventional radiological feature-based differential diagnosis of lung nodules.Eur Radiol. 2025 Jun;35(6):2968-2978. doi: 10.1007/s00330-024-11221-5. Epub 2024 Nov 27. Eur Radiol. 2025. PMID: 39604651
-
External validation of radiomics-based predictive models in low-dose CT screening for early lung cancer diagnosis.Med Phys. 2020 Sep;47(9):4125-4136. doi: 10.1002/mp.14308. Epub 2020 Jun 23. Med Phys. 2020. PMID: 32488865 Free PMC article.
-
Preoperative diagnosis of malignant pulmonary nodules in lung cancer screening with a radiomics nomogram.Cancer Commun (Lond). 2020 Jan;40(1):16-24. doi: 10.1002/cac2.12002. Epub 2020 Mar 3. Cancer Commun (Lond). 2020. PMID: 32125097 Free PMC article.
-
Feature selection methods and predictive models in CT lung cancer radiomics.J Appl Clin Med Phys. 2023 Jan;24(1):e13869. doi: 10.1002/acm2.13869. Epub 2022 Dec 17. J Appl Clin Med Phys. 2023. PMID: 36527376 Free PMC article. Review.
-
Expanding Role of Advanced Image Analysis in CT-detected Indeterminate Pulmonary Nodules and Early Lung Cancer Characterization.Radiology. 2023 Oct;309(1):e222904. doi: 10.1148/radiol.222904. Radiology. 2023. PMID: 37815447 Free PMC article. Review.
Cited by
-
Machine Learning Radiomics Model for Early Identification of Small-Cell Lung Cancer on Computed Tomography Scans.JCO Clin Cancer Inform. 2021 Jun;5:746-757. doi: 10.1200/CCI.21.00021. JCO Clin Cancer Inform. 2021. PMID: 34264747 Free PMC article.
-
Radiomics Based Bayesian Inversion Method for Prediction of Cancer and Pathological Stage.IEEE J Transl Eng Health Med. 2021 Aug 30;9:4300208. doi: 10.1109/JTEHM.2021.3108390. eCollection 2021. IEEE J Transl Eng Health Med. 2021. PMID: 34522470 Free PMC article.
-
Radiomics nomogram: A noninvasive tool for preoperative evaluation of the invasiveness of pulmonary adenocarcinomas manifesting as ground-glass nodules.Transl Oncol. 2021 Jan;14(1):100936. doi: 10.1016/j.tranon.2020.100936. Epub 2020 Nov 20. Transl Oncol. 2021. PMID: 33221688 Free PMC article.
-
Machine Learning and Radiogenomics: Lessons Learned and Future Directions.Front Oncol. 2018 Jun 21;8:228. doi: 10.3389/fonc.2018.00228. eCollection 2018. Front Oncol. 2018. PMID: 29977864 Free PMC article. Review.
-
Artificial intelligence in gastric cancer: a translational narrative review.Ann Transl Med. 2021 Feb;9(3):269. doi: 10.21037/atm-20-6337. Ann Transl Med. 2021. PMID: 33708896 Free PMC article. Review.
References
-
- McKee BJ, Regis SM, McKee AB, Flacke S, Wald C. Performance of ACR Lung‐RADS in a Clinical CT Lung Screening Program. J Am Coll Radiol. 2015;12:273–276. - PubMed
-
- Armato SG, Giger ML, Moran CJ, Blackburn JT, Doi K, MacMahon H. Computerized detection of pulmonary nodules on CT scans. Radiographics. 1999;19:1303–1311. - PubMed
MeSH terms
Grants and funding
LinkOut - more resources
Full Text Sources
Other Literature Sources
Medical
