. 2018 Apr;25(3):e12445.
doi: 10.1111/micc.12445.

Modeling the hematocrit distribution in microcirculatory networks: A quantitative evaluation of a phase separation model

Affiliations

Modeling the hematocrit distribution in microcirculatory networks: A quantitative evaluation of a phase separation model

Peter M Rasmussen et al. Microcirculation. 2018 Apr.

Abstract

Objective: Theoretical models are essential tools for studying microcirculatory function. Recently, the validity of a well-established phase separation model was questioned and it was claimed that it produces problematically low hematocrit predictions and lack of red cells in small diameter vessels. We conducted a quantitative evaluation of this phase separation model to establish common ground for future research.

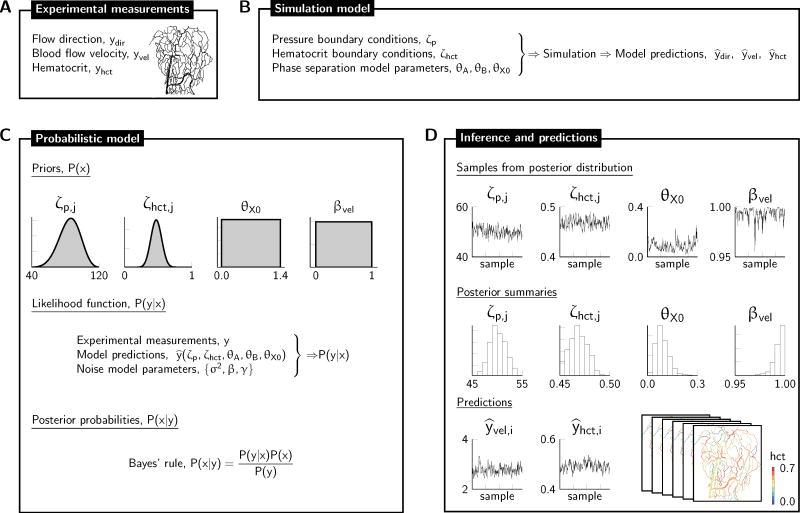
Methods: Model predictions were validated against a comprehensive database with measurements from 4 mesenteric networks. A Bayesian data analysis framework was used to integrate measurements and network model simulations into a combined analysis and to model uncertainties related to network boundary conditions as well as phase separation model parameters. The model evaluation was conducted within a cross-validation scheme.

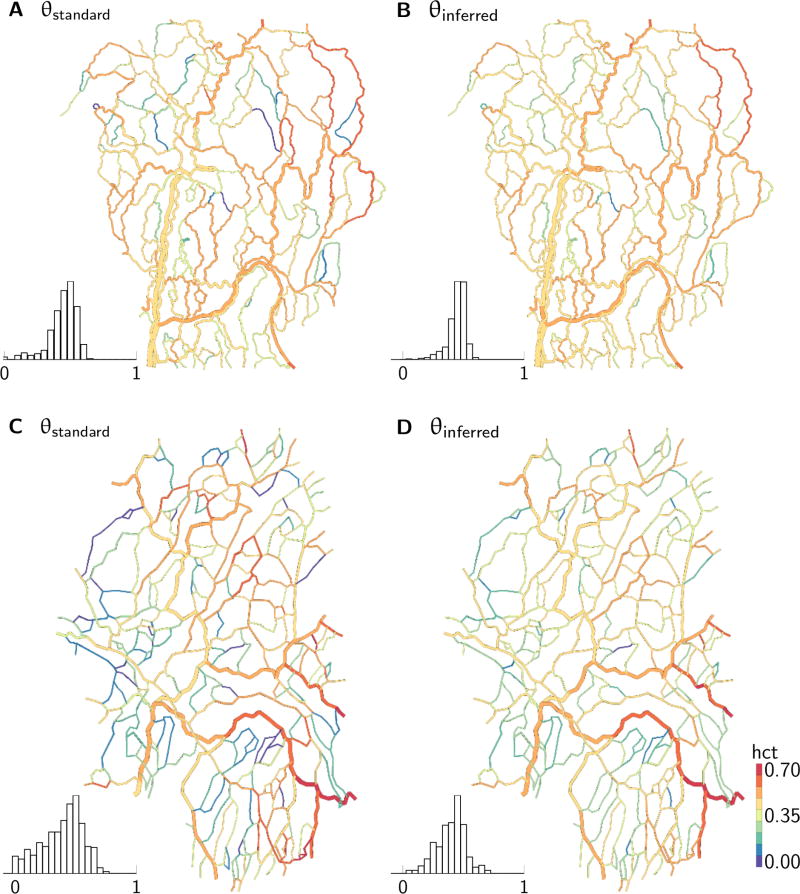
Results: Unlike the recently reported results, our analysis demonstrated good correspondence in global characteristics between measurements and predictions. In particular, predicted hematocrits for vessels with small diameters were consistent with measurements. Incorporating phase separation model parameter uncertainties further reduced the hematocrit validation error by 17% and led to the absence of red-cell-free segments. Corresponding model parameters are presented as alternatives to standard parameters.

Conclusions: Consistent with earlier studies, our quantitative model evaluation supports the continued use of the established phase separation model.

Keywords: Bayesian inference; flow simulation; microcirculatory measurements; phase separation effect; quantitative model evaluation.


Figures

Figure 1
Figure 1
A: Photomontage of a mesenteric microvessel network (network 1). B: Measured hematocrit in network 1. C: Measured hematocrit in network 4. Arrows indicate main arteriolar inlets and venular outlets. Segment diameters are doubled relative to the figure scale in B and C to enhance visibility.
Figure 2
Figure 2
Approach to combine experimental measurements and model simulation in a network-oriented analysis. A: Experimental measurements comprise measurements of blood flow directions ydir and hematocrit yhctas well as network topology and morphology in four networks and also measurements of blood flow velocities yvel in three of the four networks. B: The flow simulation model yields predictions y^of blood flow directions, hematocrit, and blood flow velocities throughout the networks. The flow simulation model requires prescription of appropriate values for pressure boundary conditions ζp, and hematocrit boundary conditions ζhct. The simulation model also incorporates a series of empirical rheological discriptions, which, in turn, are parameterized by fitted parameters θ, for example the parameters of the phase separation model {θA,θB,θX0}. C: Experimental measurements and flow model simulations are combined within a Bayesian probabilistic analysis framework [30]. The probabilistic approach allows the uncertain boundary conditions and also the phase separation model parameters to be associated with uncertainty instead of being ascribed with fixed parameter values. x={ζp,ζhct,θA,θB,θX0,β,σ2,γ} concatenates the uncertain parameters, with {β,σ2,γ} being parameters of the hematocrit, velocity, and flow direction likelihood functions. Priors P() governing pressure boundary conditions (mmHg) and hematocrit boundary conditions varies with vessel type and vessel diameter, and shown are example priors governing a single boundary node J. A broad prior governing the θX0 parameter of the phase separation model and a prior governing the kurtosis parameter βvel of the velocity error model are also shown. The “distance” between the experiemental measurements and model simulations is quantified by the likelihood function P(y|x), which, in turn, is governed by the set of parameters {β,σ2,γ}. Bayes’ rule yields the posterior distribution governing the uncertain parameters, with P(y) being the model evidence. This posterior distribution cannot be inferred by analytical means, and instead we use MCMC sampling D for postierior inference. MCMC sampling provides samples from the posterior distribution, and a series of samples corresponding to the parameters in C are shown. The samples can be used to summarize the posterior distribution, and marginal distributions are shown as a summary example. The samples can further be propagated through the simulation model B to evaluate how, for example, boundary condition uncertainty propagates to uncertainties in the simulation model’s predicitons (predictions for a single vessel i are shown). This results in multiple predictions of hemodynamic variables throughout the networks, as represented by the stack of hematocrit predictions.
Figure 3
Figure 3
Quantitative evaluation of model predictions in four mesenteric networks based on split-half resampling. Dots mark individual resampling splits (50 in total), outlines represent density estimates, and red lines represent medians. Results corresponding to models with two different prior distributions (Dirac, broad) governing the phase separation model parameters are shown. θstandard corresponds to the analysis with the Dirac prior (standard values for phase separation model parameters), and θinferred corresponds to the analysis with the broad prior.
Figure 4
Figure 4
Scatter plots comparing measured and predicted hematocrit in four mesenteric networks (1710 segments). Black dots mark mean model predictions (based on validation segments) and gray lines mark predictive range across the 50 resampling splits. θstandard corresponds to the analysis with the Dirac prior (standard values for phase separation model parameters), and θinferred corresponds to the analysis with the broad prior.
Figure 5
Figure 5
Comparison of measured and predicted hematocrit as grouped by vessel diameter in four mesenteric networks (1710 segments). Hematocrit was normalized by the measured main inlet hematocrit for the individual networks. Black dots mark measurements and median (validation) predictions. Outlines represent density estimates. θstandard corresponds to the analysis with the Dirac prior (standard values for phase separation model parameters), and θinferred corresponds to the analysis with the broad prior.
Figure 6
Figure 6
Spatial representation of predicted hematocrit in network 1 (A-B) and network 4 (C-D). Segment hematocrits represent averages across all resampling split-halves. Hematocrit distributions are shown as insets. Segment diameters are doubled relative to the figure scale to enhance visibility. θstandard corresponds to the analysis with the Dirac prior (standard values for phase separation model parameters), and θinferred corresponds to the analysis with the broad prior.
Figure 7
Figure 7
Marginal posterior distributions representing the inferred phase separation model parameters (θA, θB, and θX0). The red dashed lines represent prior distributions, the thin gray lines represent density estimates based on models calibrated on individual split-halves (100 splits-halves in total), and the dark gray frequency histograms represent samples pooled across all 50 resampling splits.
Figure 8
Figure 8
A: Spatial representation of network 4. B: Zoom (rotated) on section in the vicinity of the main feeding arteriole marked in A. Arrows indicate measured flow directions. Measured hematocrit and average predicted hematocrit are reported in the format: measurement/θstandardinferred, with θstandard and θinferred corresponding to the analyses with the Dirac prior (standard values) and the broad prior, respectively. Bold numbers mark daughter segments of bifurcations for which the standard PS model parameters leads to low hematocrit prediction in comparison to predictions when using the inferred parameter values. Red, green, and blue colors represent arterioles, capillaries and venules respectively. Segment diameters are doubled relative to the figure scale to enhance visibility.
Figure 9
Figure 9
Single bifurcation evaluation of the inferred posterior distribution of the phase separation model coefficients (Figure 7) illustrating the extent to which the uncertainties represented by the marginal distributions in Figure 7 and between parameter correlations in Table 3 affect the phase separation model at single bifurcation level. Bifurcation configurations: HD=0.49/0.42/0.43, DF=20/7.5/27.7, Dα=16.5/6/7.4, and Dβ=17.5/8/23.1(bifurcation I / bifurcation II / bifurcation III). Dotted lines represent model prediction using standard model parameters in eq. 2–4, while dashed lines represent mean predictions obtained with the broad prior (surrounding lines represent 95% credible intervals).
Figure 10
Figure 10
Fractional discharge hematocrit versus fractional blood flow for bifurcation III (marked with * in Figure 8). Dotted lines represent model prediction using standard model parameters in eq. 2–4, while dashed lines represent mean predictions obtained with the informative prior (surrounding lines represent 95% credible intervals).
Figure 11
Figure 11
Residual analysis. Quantile-quantile plots comparing theoretical quantiles against observed quantiles. Theoretical quantiles were calculated by use of the error model Eq. 5 and MCMC chain samples of the noise model parameters σ and β (estimated from calibration samples). Observed quantiles were based on residuals calculated from validation samples. The dots represent averages across all MCMC chain iterations and all resampling splits. Insets show histograms of observed (validation) residuals overlaid by the theoretical error probability distributions. θstandard corresponds to the analysis with the Dirac prior (standard values for phase separation model parameters), and θinferred corresponds to the analysis with the broad prior.

Similar articles

Cited by

References

    1. Corrigendum. Microcirculation. 2015;22:434–434. - PubMed
    1. Bennett ND, Croke BFW, Guariso G, Guillaume JHA, Hamilton SH, Jakeman AJ, Marsili-Libelli S, Newham LTH, Norton JP, Perrin C, Pierce SA, Robson B, Seppelt R, Voinov AA, Fath BD, Andreassian V. Characterising performance of environmental models. Environmental Modelling & Software. 2013;40:1–20.
    1. Box GEP, Tiao GC. Bayesian inference in statistical analysis. Reading, Mass: Addison-Wesley Pub. Co; 1973.
    1. Cleveland WS, Loader C. Smoothing by Local Regression: Principles and Methods. In: Härdle W, Schimek MG, editors. Statistical Theory and Computational Aspects of Smoothing: Proceedings of the COMPSTAT ’94 Satellite Meeting held in Semmering, Austria, 27–28 August 1994. Heidelberg: Physica-Verlag HD; 1996. pp. 10–49.
    1. Cokelet GR, Pries AR, Kiani MF. Observations on the Accuracy of Photometric Techniques Used to Measure Some In Vivo Microvascular Blood Flow Parameters. Microcirculation. 1998;5:61–70. - PubMed

Publication types

LinkOut - more resources