

Evidence of Alternative Modes of B Cell Activation Involving Acquired Fab Regions of N-Glycosylation in Antibody-Secreting Cells Infiltrating the Labial Salivary Glands of Patients With Sjögren's Syndrome
- PMID: 29457375
- PMCID: PMC6019603
- DOI: 10.1002/art.40458
Evidence of Alternative Modes of B Cell Activation Involving Acquired Fab Regions of N-Glycosylation in Antibody-Secreting Cells Infiltrating the Labial Salivary Glands of Patients With Sjögren's Syndrome
Abstract
Objective: To better understand the role of B cells, the potential mechanisms responsible for their aberrant activation, and the production of autoantibodies in the pathogenesis of Sjögren's syndrome (SS), this study explored patterns of selection pressure and sites of N-glycosylation acquired by somatic mutation (acN-glyc) in the IgG variable (V) regions of antibody-secreting cells (ASCs) isolated from the minor salivary glands of patients with SS and non-SS control patients with sicca symptoms.
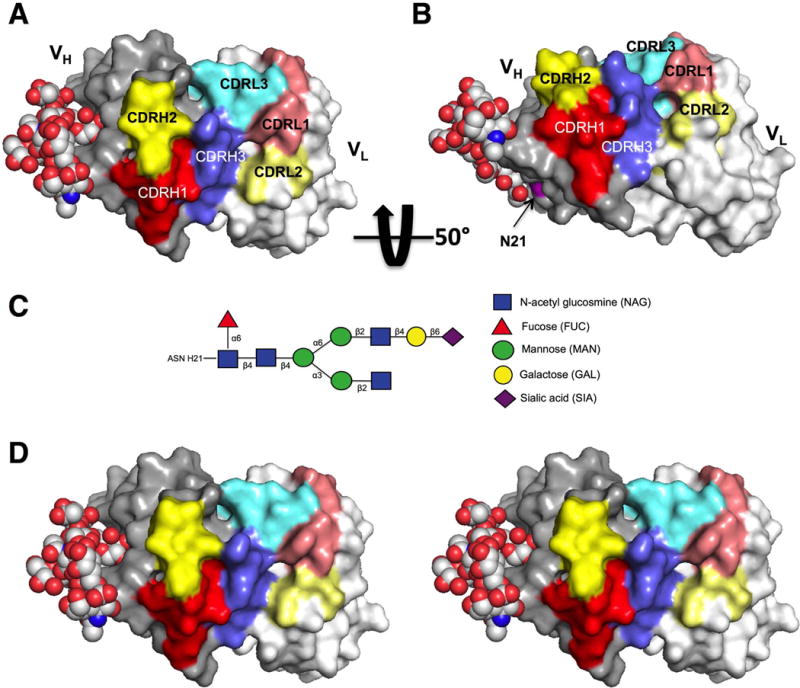
Methods: A novel method to produce and characterize recombinant monoclonal antibodies (mAb) from single cell-sorted ASC infiltrates was applied to concurrently probe expressed genes (all heavy- and light-chain isotypes as well as any other gene of interest not related to immunoglobulin) in the labial salivary glands of patients with SS and non-SS controls. V regions were amplified by reverse transcription-polymerase chain reaction, sequenced, and analyzed for the incidence of N-glycosylation and selection pressure. For specificity testing, the amplified regions were expressed as either the native mAb or mutant mAb lacking the acN-glyc motif. Protein modeling was used to demonstrate how even an acN-glyc site outside of the complementarity-determining region could participate in, or inhibit, antigen binding.
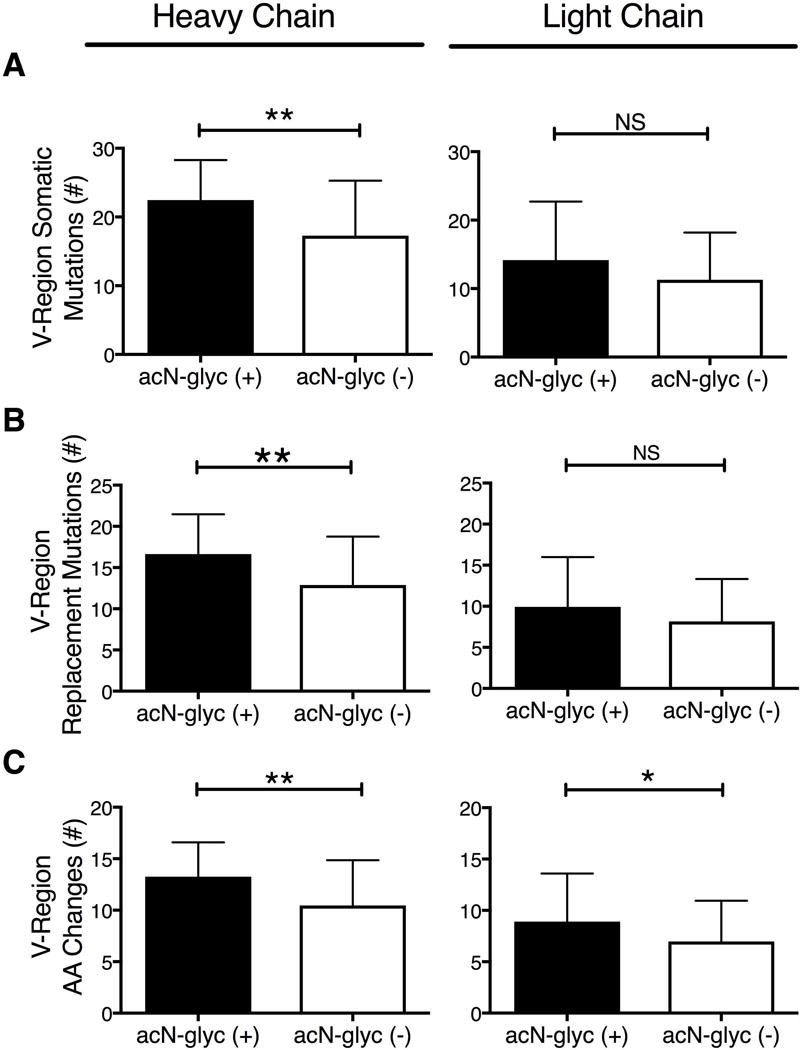
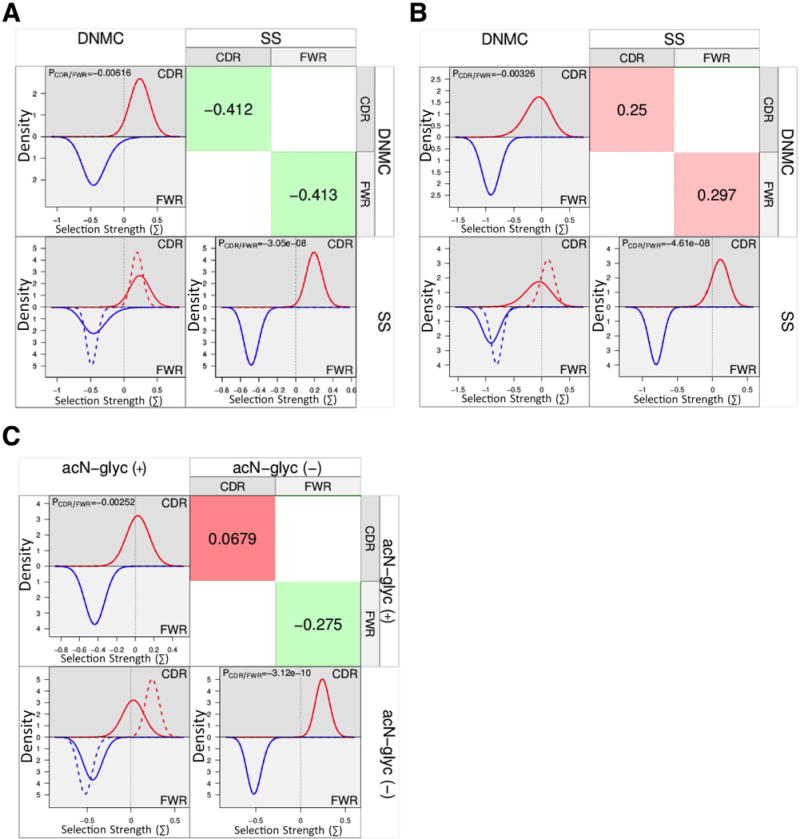
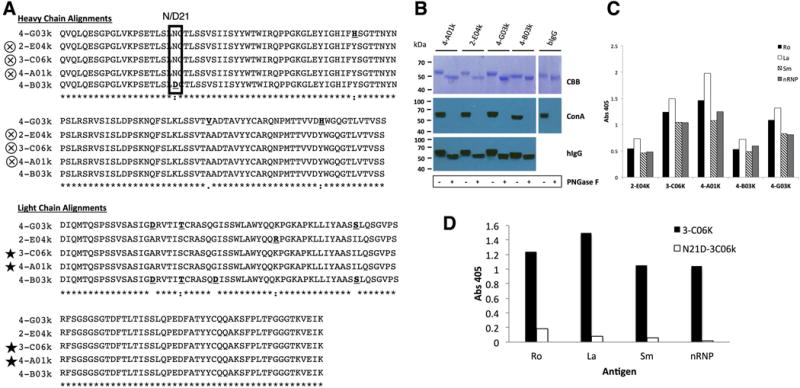
Results: V-region sequence analyses revealed clonal expansions and evidence of secondary light-chain editing and allelic inclusion, of which neither of the latter two have previously been reported in patients with SS. Increased frequencies of acN-glyc were found in the sequences from patients with SS, and these acN-glyc regions were associated with an increased number of replacement mutations and lowered selection pressure. A clonal set of polyreactive mAb with differential framework region 1 acN-glyc motifs was also identified, and removal of the acN-glyc could nearly abolish binding to autoantigens.
Conclusion: These findings support the notion of an alternative mechanism for the selection and proliferation of some autoreactive B cells, involving V-region N-glycosylation, in patients with SS.
© 2018, American College of Rheumatology.
Figures
Similar articles
-
Analysis of V(H)-D-J(H) gene transcripts in B cells infiltrating the salivary glands and lymph node tissues of patients with Sjögren's syndrome.Arthritis Rheum. 1999 Feb;42(2):240-7. doi: 10.1002/1529-0131(199902)42:2<240::AID-ANR5>3.0.CO;2-I. Arthritis Rheum. 1999. PMID: 10025917
-
Acquisition of N-Glycosylation Sites in Immunoglobulin Heavy Chain Genes During Local Expansion in Parotid Salivary Glands of Primary Sjögren Patients.Front Immunol. 2018 Mar 12;9:491. doi: 10.3389/fimmu.2018.00491. eCollection 2018. Front Immunol. 2018. PMID: 29662487 Free PMC article.
-
Antibody-secreting cell specificity in labial salivary glands reflects the clinical presentation and serology in patients with Sjögren's syndrome.Arthritis Rheumatol. 2014 Dec;66(12):3445-56. doi: 10.1002/art.38872. Arthritis Rheumatol. 2014. PMID: 25199908 Free PMC article.
-
[Molecular mechanism on Sjögren's syndrome].Nihon Rinsho. 1995 Oct;53(10):2395-400. Nihon Rinsho. 1995. PMID: 8531344 Review. Japanese.
-
Sjögren's syndrome.Eur J Oral Sci. 2005 Apr;113(2):101-13. doi: 10.1111/j.1600-0722.2004.00183.x. Eur J Oral Sci. 2005. PMID: 15819815 Review.
Cited by
-
Proteogenomic analysis of the autoreactive B cell repertoire in blood and tissues of patients with Sjögren's syndrome.Ann Rheum Dis. 2022 May;81(5):644-652. doi: 10.1136/annrheumdis-2021-221604. Epub 2022 Feb 10. Ann Rheum Dis. 2022. PMID: 35144926 Free PMC article.
-
Immunoglobulin gene analysis as a tool for investigating human immune responses.Immunol Rev. 2018 Jul;284(1):132-147. doi: 10.1111/imr.12659. Immunol Rev. 2018. PMID: 29944755 Free PMC article. Review.
-
Abnormal B cell glycosylation in autoimmunity: A new potential treatment strategy.Front Immunol. 2022 Aug 25;13:975963. doi: 10.3389/fimmu.2022.975963. eCollection 2022. Front Immunol. 2022. PMID: 36091064 Free PMC article.
References
-
- Shiboski SC, Shiboski CH, Criswell L, Baer A, Challacombe S, Lanfranchi H, et al. American College of Rheumatology classification criteria for Sjogren’s syndrome: a data-driven, expert consensus approach in the Sjogren’s International Collaborative Clinical Alliance cohort. Arthritis Care Res (Hoboken) 2012;64(4):475–87. - PMC - PubMed
-
- Ramos-Casals M, Brito-Zeron P, Font J. The overlap of Sjogren’s syndrome with other systemic autoimmune diseases. Semin Arthritis Rheum. 2007;36(4):246–55. - PubMed
-
- Garcia-Carrasco M, Ramos-Casals M, Rosas J, Pallares L, Calvo-Alen J, Cervera R, et al. Primary Sjogren syndrome: clinical and immunologic disease patterns in a cohort of 400 patients. Medicine (Baltimore) 2002;81(4):270–80. - PubMed
-
- Davidson BK, Kelly CA, Griffiths ID. Primary Sjogren’s syndrome in the North East of England: a long-term follow-up study. Rheumatology (Oxford) 1999;38(3):245–53. - PubMed
Publication types
MeSH terms
Grants and funding
LinkOut - more resources
Full Text Sources
Other Literature Sources
Medical
Miscellaneous
